When a gaming laptop is running modern games this puts a heavy load on the CPU, resulting in more heat output which can degrade or damage internal components. Manufacturers have various options to mitigate this problem, including the installation of high capacity heat sinks and fans. It takes expert knowledge to determine the optimal solution, since high performance heat sinks and fans are expensive, while simply adding more fans can cause more noise, which degrades the gaming experience.
Allion test engineers are seasoned professionals with practical expertise in design optimization. Recently, our engineers applied these skills by evaluating the acoustical properties of two gaming laptops designed by a brand name company (A).
The two gaming laptops (A1 and A2) came with different displays:
- Laptop A1 had a 17.3” display (DUT1)
- Laptop A2 had a 15.6” display (DUT2)
Our test team performed the following acoustical tests:
- Acoustic Noise: Keyboard Typing Noise and System Noise Tests
- Speaker Output Characteristic Test
Keyboard Typing Noise Test
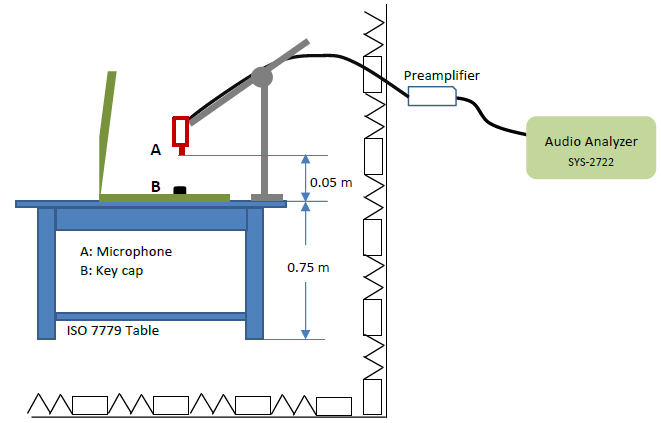
The first part of the Acoustic Noise testing involved recording touch typing sounds. With the gaming laptop powered off, we recorded the sound volume (in decibels) of a single finger touching the keyboard at a frequency of three (3) times per second. Figure 1 indicates the laptop and microphone locations.
Figure 1 : Keyboard Typing Noise Test – DUT Placement & Microphone Location
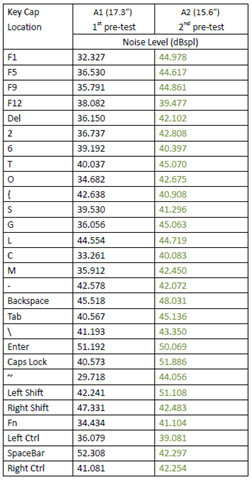
For this test, we set the maximum acceptable volume at 55 dB for standard keys, and 60 dB for the function and space keys. In Table 1, we see that none of the key tests exceeded 55 dB SPL, so both laptops (A1 and A2) passed this test with flying colors.
Table 1 : Keyboard Typing Noise Test Results
Note: Background sound (2nd pre-test): 22.488 dB SPL
System Noise Test
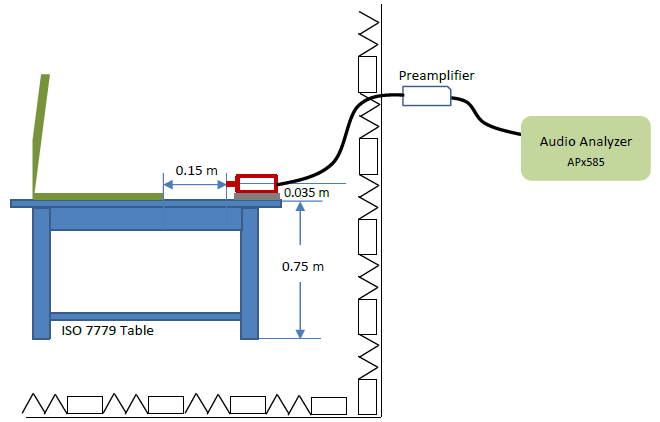
In this test, we checked the noise of the A1 system under idle and heavy loading conditions with AC power ON. Before recording the A1 system noise in the idle state, we waited an hour for the wireless radios (Wi-Fi and Bluetooth®) to switch off.
Figure 2 shows the placement of system A1 relative to the microphone.
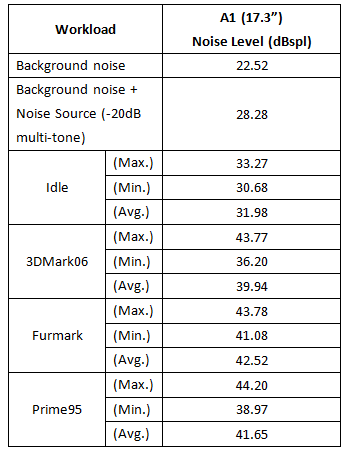
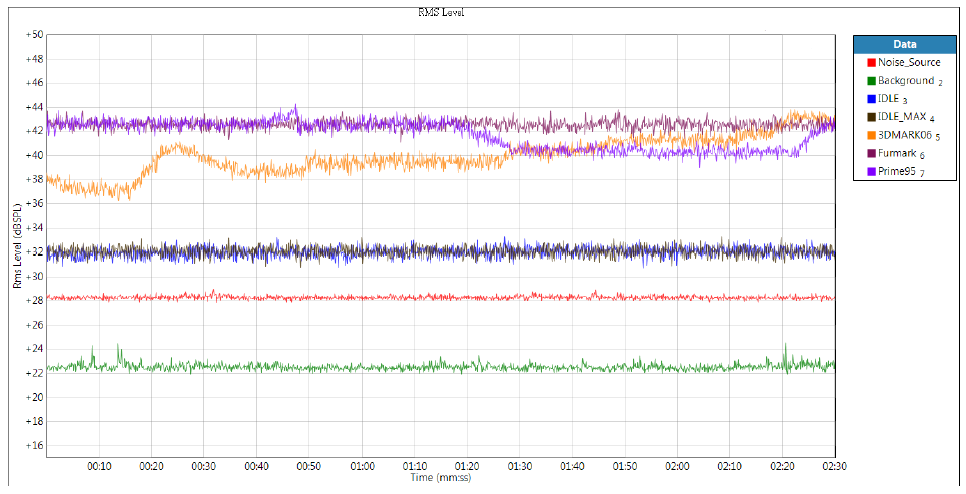
To simulate heavy system loading, we chose the following three test suites: 3DMark06, FurMark, and Prime95. Before recording the A1 system noise under heavy loading, we waited an hour for the wireless radios (Wi-Fi and Bluetooth®) to switch off. For the FurMark and Prime95 test suites, CPU and GPU reached 100% performance; and the loudest noises were detected with these two test items, as shown in Table 2 below.
Table 2 : System Noise Test Results
Figure 3 : System Noise under Different Loading Conditions
Speaker Output Characteristic Test
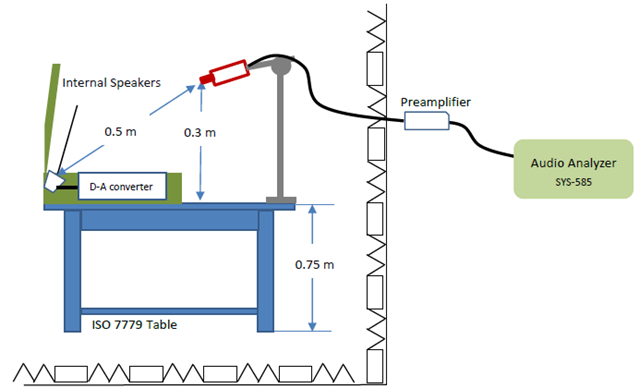
This test determines the maximum output distortion by measuring the degree of difference between the digital audio and the analog speaker output. This is accomplished by comparing the audio output through the codec and AUD. Prior to testing the A1 system; we turned off its AUD and system sound effects and turned up its internal speakers to full volume. Figure 4 shows the test configuration.
Figure 4 : Speaker Output – DUT Placement & Microphone Location
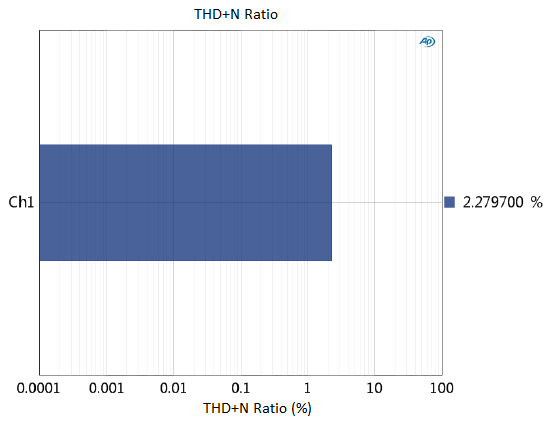
The test method involved playing a 1000 Hz 0 dB full-scale sine wave audio signal for 30 seconds. This signal was then analyzed using the APx585 multichannel audio analyzer shown in Figure 5. The speaker output distortion should be less than 1%.
Figure 5 : APx585 Audio Analyzer
According to Picture 5 we can see that the maximum output distortion is about 2.3%. Although the distortion rate is still slight, it still exceeds the 1% test criteria, which suggests that the manufacturer should lower the audio file gain ratio. This would reduce the output distortion at high volumes, for improved sound quality.
Figure 6 : Speaker Output Characteristic Test Result
Conclusion
To better serve the increasing customer demand for acoustic and audio testing, Allion Labs, Inc. is proud to announce the opening of its Anechoic Chamber at its Central Taiwan Science Park (CTSP) Branch. Accredited by EC-60268, ISO7779 and 3GPP TS26 132 (following ISO3744/3745), Allion’s Anechoic Chamber is equipped with a high-specification audio analyzer, high sensitivity microphone, preamplifier, and decibel meter. With this new test facility, we can now perform advanced acoustical analysis of appliances, devices, materials, and components.
The Anechoic Chamber’s interior diagonal length is 5 m and it can transform into qualified Half-Anechoic Chambers in just 30 minutes. It can measure sound pressure, acoustic power, and sound quality:
- Electro-Acoustic (e.g. frequency response, distortion, signal noise ratio)
- Acoustic Noise (e.g. fan noise, vibrating mechanism)
- Sound Pressure Level (e.g. maximum sound pressure, sensitivity)
As an expert in product validation, Allion continues to expand with its focus on providing comprehensive customer services. We specially built 13 shielding rooms to provide a large capacity of wireless test environment with low sources of interference. All shielding rooms are equipped with USB and RJ45 junction boxes that can operate independently and automatically control external interfaces to remotely monitor DUTs and test-related devices. To learn more about our new test facility and services, please contact us atservice@allion.com.


