


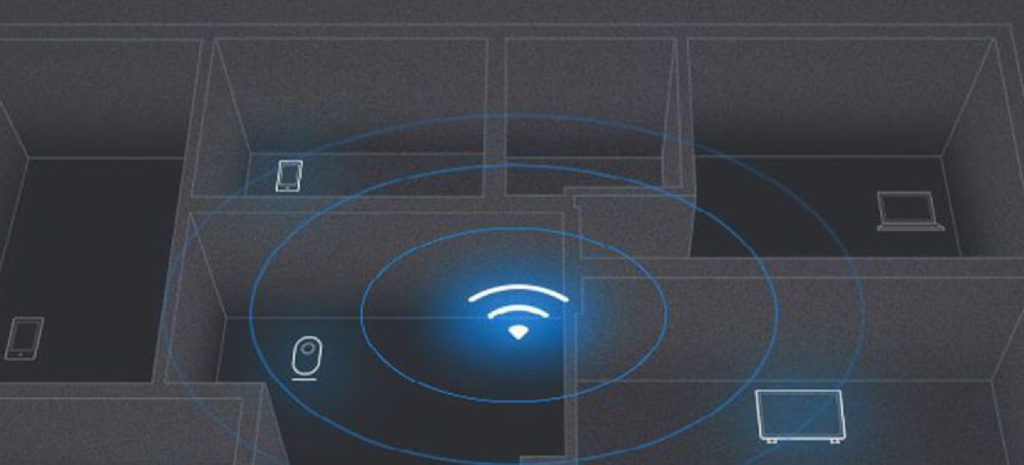
Traditionally, we use our mobile phones, personal computers, and laptops to go online. Nowadays, with the rise of IoT devices and their diverse applications, more devices can be connected to the internet. Households are filled with smart devices such as smart TVs, smart lighting, smart speakers, machines, and thermometers. When we are building network at home, we often encounter two issues:
- Is the signal strong enough to reach every corner of the room?
- Are all IoT devices seamlessly connected to the network?
In this article, we will derive the relationship among the distance, AP coverage, and throughput rate by conducting a test at a two-floor house installed with APs.

A smart home is empowered by devices connecting to the network
First, let us review how we usually set up a home network. When we are building home networks, we usually have a broadband network and APs installed by telecom vendors. Since there is an expansive variety of APs on the market, most users would search for better ones. However, when buying high-end APs, how do we know if it can satisfy all our needs?
- Is signal coverage entrenched throughout the place?
- Is it necessary to buy a second AP to boost overall signal strength?
 Where should we place our APs to get the best signal coverage?
TEST 1
In the first test, the Heatmap, which is exclusively developed by Allion, is used to measure and visualize the rollout of the 5GHz signal. The alphabet letters on the image below represent the “hotspots” where users would most likely to use Wi-Fi, and we observe the signal strengths at these spots.
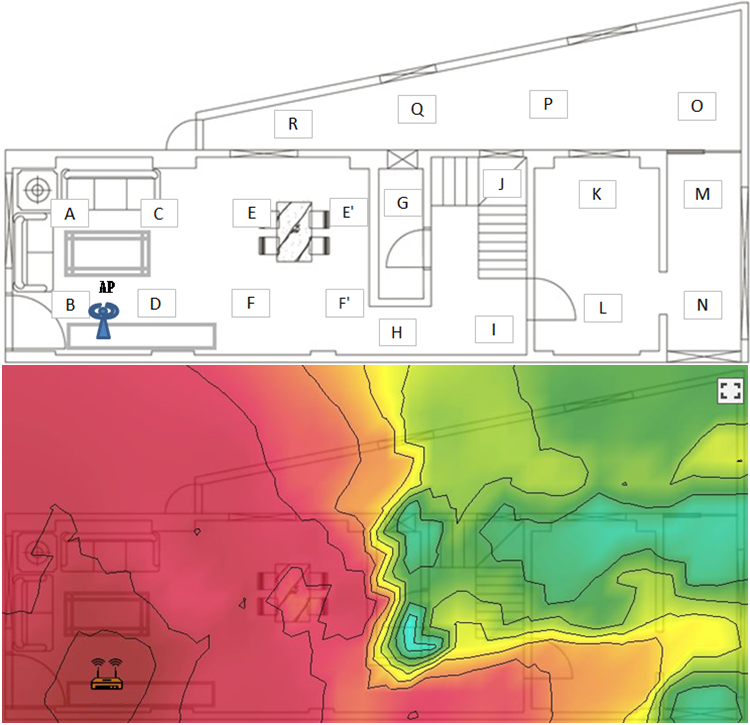
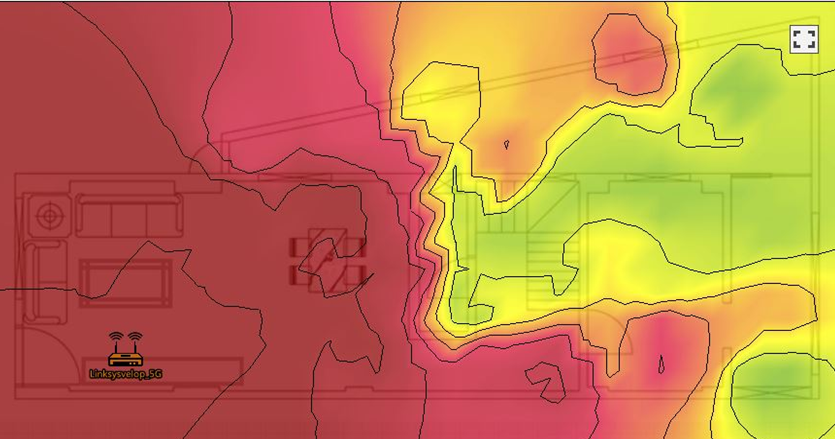
The Floor Plan of 1st Floor-AP Performance at 5GHz
The blue greenish spots on the map indicate weaker signals as these spots are where the concrete walls are. 5GHz is renowned for its high transmission speed, but with a downside of poor penetration. A concrete wall is most likely to cause depreciation in the signals, thus leading to poor network performance.
At spots G, J, K, M, we are also seeing a decrease in the Received Signal Strength Indication (RSSI), depreciating to -60~-70dBm. When RSSI is below -60dBm, the signal of your phone falls to the weakest level, when the RSSI hits -65~-70dBm, your phone loses Wi-Fi signal.
Users of Wi-Fi products will experience latency or disconnection when they watch movies, play online games, or when they try to face time at these spots.
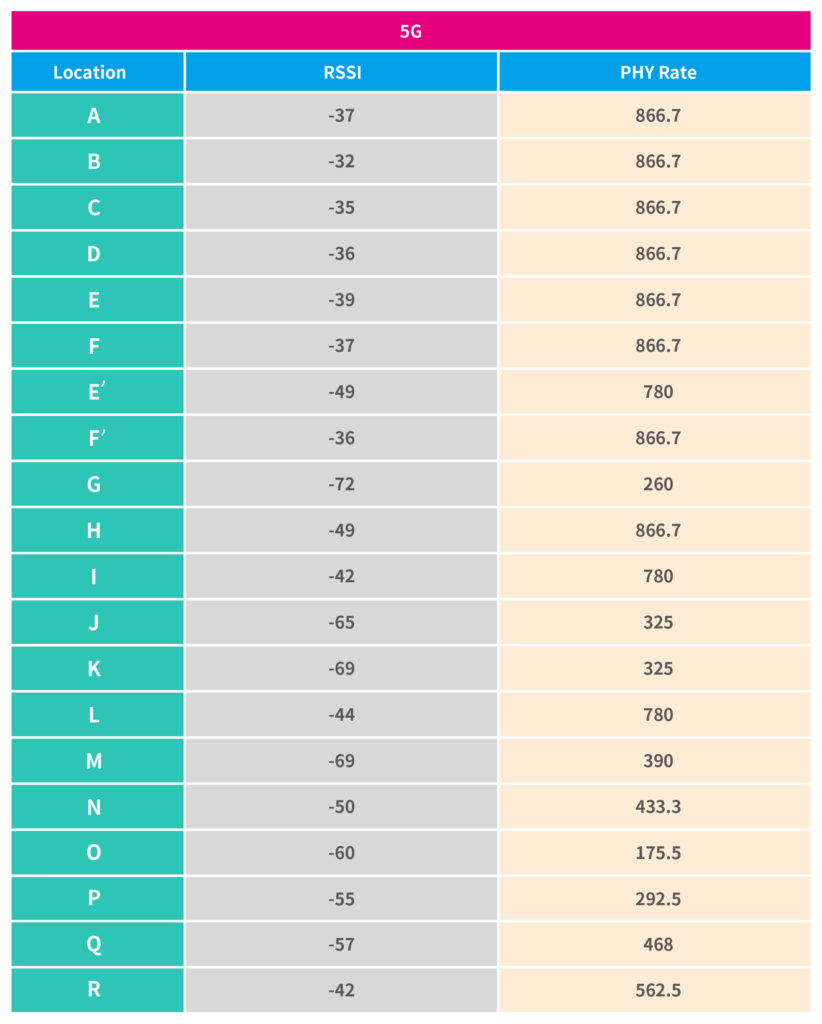 Measured spots and their respective RSSI and PHY rates at 5GHz
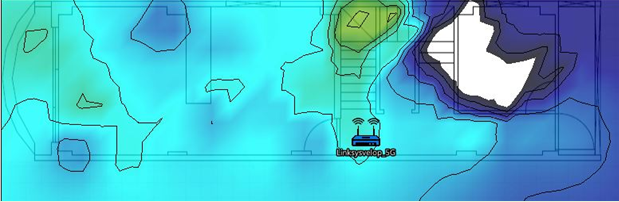
Let’s move on to measuring the signal strength on the second floor. We can see from the floor-plan that some spots are covered with dark blue, indicating a signal between -70dBm to -90dBm. As for the spots covered in white, no signal is measured at these spots.
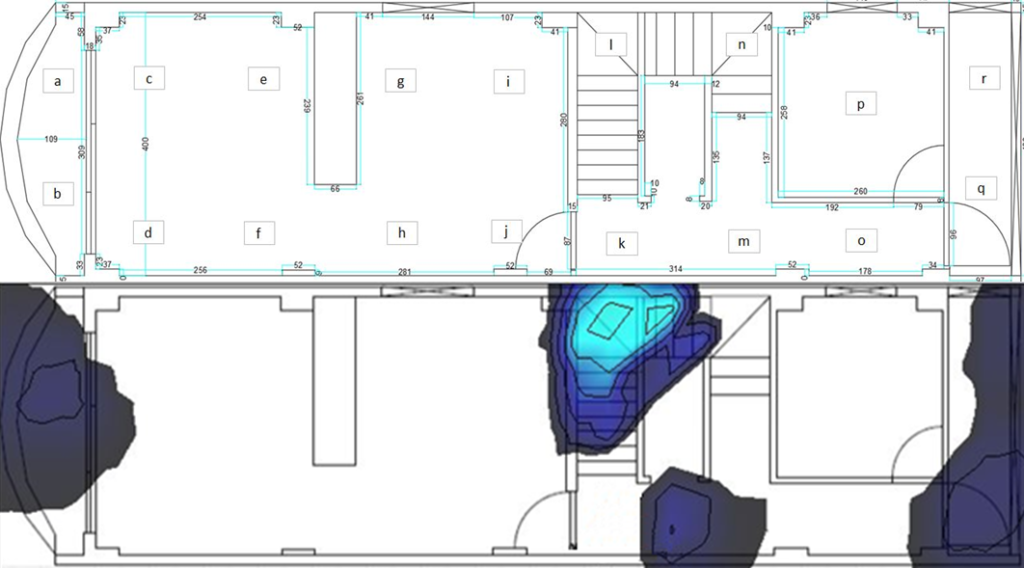
As we said earlier, 5GHz has weak wall penetrations; therefore the signals can’t be delivered to the second floor. Users can not connect their smart devices to Wi-Fi on the second floor. We strongly recommend users to install another AP or Mesh APs at each floor in multistory houses.
Test 2
For the second test, we use Heatmap to measure APs at 2.4GHz.
Floor Plan of 1st Floor-Signal Performance at 2.4GHz
Floor Plan of 2nd Floor- Signal Performance at 2.4GHz
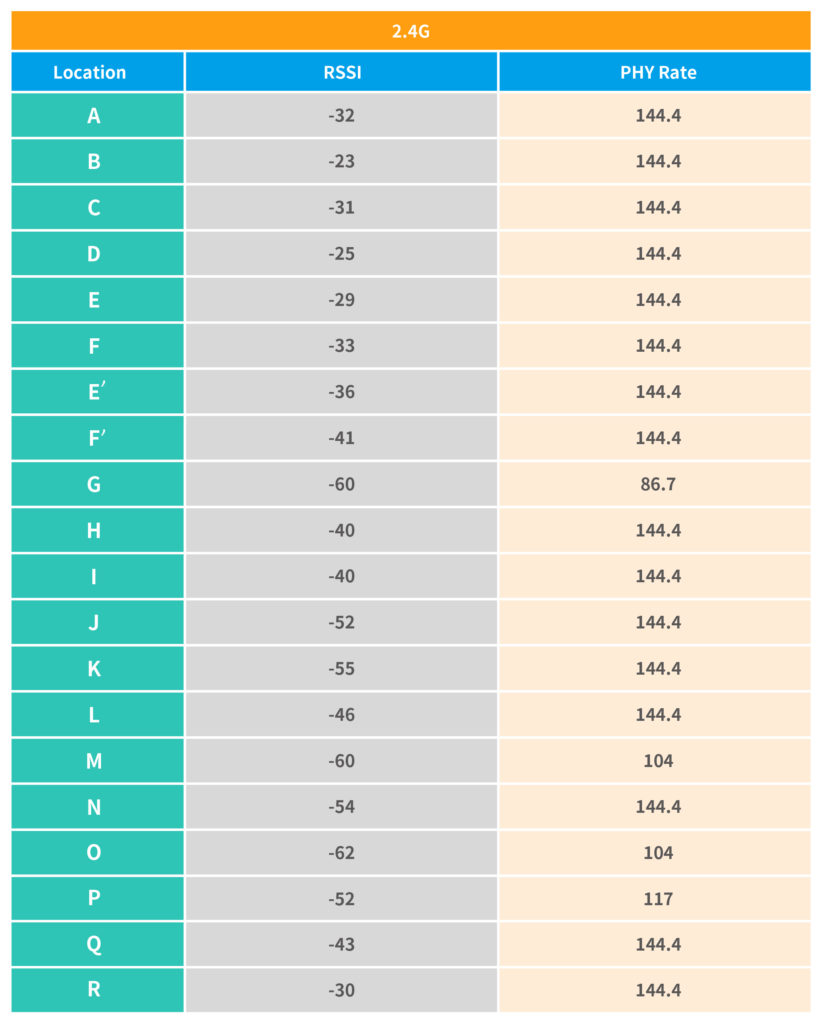 Measured spots and their respective RSSI and PHY Rate at 2.4GHz
We can derive from the above test results that the first-floor of the house has good signals, enabling users to connect to the internet smoothly. However, on the second-floor, we are witnessing much weaker signal strength (as indicated in blue colors), leading to poorer signal performance.
After measuring the signal performance at 5GHz and 2.4GHz, you might be wondering, is RSSI improving with increasing PHY rates?
Not necessarily. In the first test result, the RSSI at spot H is -49dBM with a PHY rate of 866 Mbps. But at spot E we are seeing a drop in the PHY rate (780 Mbps). There is an 86Mbps difference between spot H and E. We can conclude that there is a correlation between RSSI and throughput, but it is not always positive.
RSSI and Throughput is not positively correlated
Test 3
As for the third test item, we will be testing several applications. These applications include dialing, phone calling, online videos, browsing the internet, and file downloads.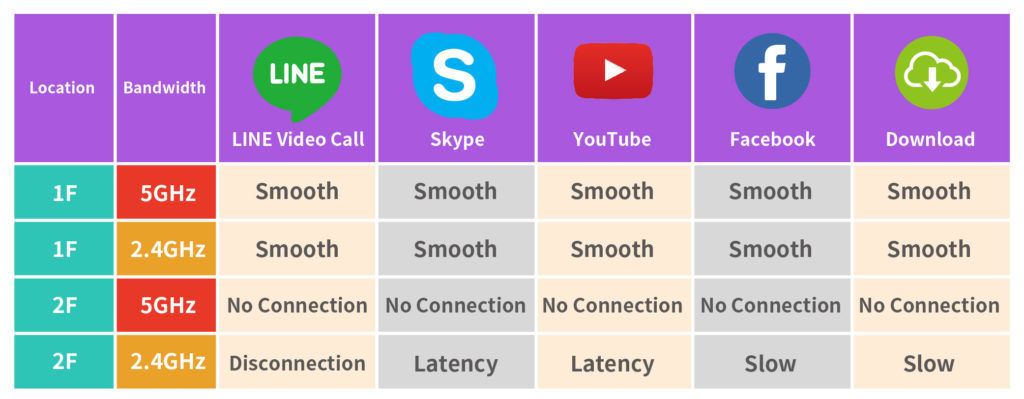
From the chart above, we know these applications are running smoothly on the first floor, but when we use the devices on the second floor, issues like latencies, disconnections, and slow internet have emerged, leading to poor user-experiences.
In conclusion, the three tests gave us an idea that the space, concrete walls, and the layout of interior designs are very likely to affect wireless signal strengths. Allion Labs have years of RF testing and we can provide specific testing solutions for your home networks. We ensure your IoT can communicate freely and seamlessly anywhere inside the house.
In the next article, we will be exploring the capabilities of the equipment and devices, and in-depth comparison of RF capabilities on different products. Stay tuned to Allion tech blogs!