


General Overview
With the rapid development of the IT industry, transfer quality, speed and application diversity have initiated a continued drive towards the development of faster transfer speeds. In order to enhance signal transfer encoding speed and shorten user waiting sessions. 1. Lowering package precision. 2. Providing full duplex transfer modes are both plausible ways to tackle the issue. In order to reach this goal, all individual components must be able to minimize signal decay, distortion and resistance towards interference.
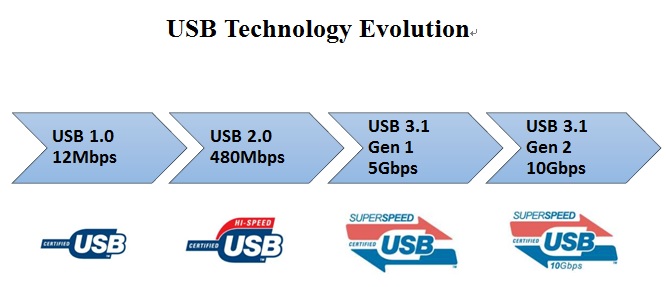
Hence, the connector which acts as a bridge would also require an upgrade, due to the increasing role it plays in transmission quality and speed. The flow chart below shows the evolution of USB transmission speed from USB 1.0 to USB 3.1 Gen 2. Another important point to mention is the transmission mode which upgraded from half-duplex to full duplex.
Appearance
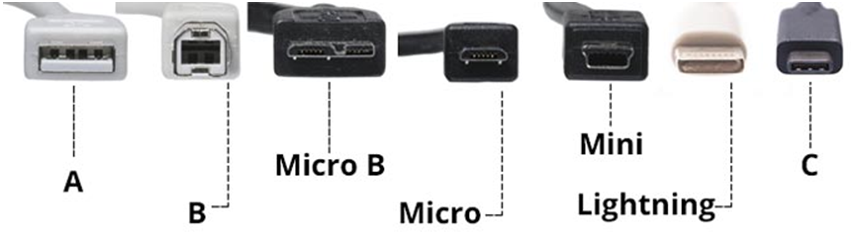
Consumer electronics (CE) are now experiencing a “slimming down” trend, becoming ever smaller and slimmer. Apart from the speed boost we mentioned earlier, with a strong driving force from the smartphone industry; connector appearance and size have become smaller and smaller. USB evolution has also been influenced by the same factors, From A / B type development to Mini USB, also in 2007 we saw Micro USB spur from this trend. We can observe that, besides being slim and light weight, performance and simplicity for plugging and unplugging are all factors Which influence this developing trend.
Performance
In the days, connectors were only required to have electrical current conductivity and not transmit large amounts of data. Mechanical performance was the focus for testing. For example Mating &Un-mating force, Durability test, terminal contact retention force, contact resistance testing, etc. These and other factors would all affect conductivity and mechanical factors. USB and IEEE1394 had become available after 2000; thus, prompting the entry of a new age for connectors from only requiring conductivity of the electrical current to being able to transmit large amounts of data. Now with the addition of Impedance, Propagation Delay, Propagation Skew, Attenuation, Crosstalk testing, etc. Through these new additions we would be able to better validate signal integrity.
Interference
The increase of transmission load triggered the demand for high frequency connectors such as HDMI, DisplayPort and USB 3.1 Type-C. The transfer speed of connectors increased from Mbps levels to Gbps levels. Thus when the signal speed continues to increase, interference levels also raise. Therefore, lowering interference levels have become ever more important.
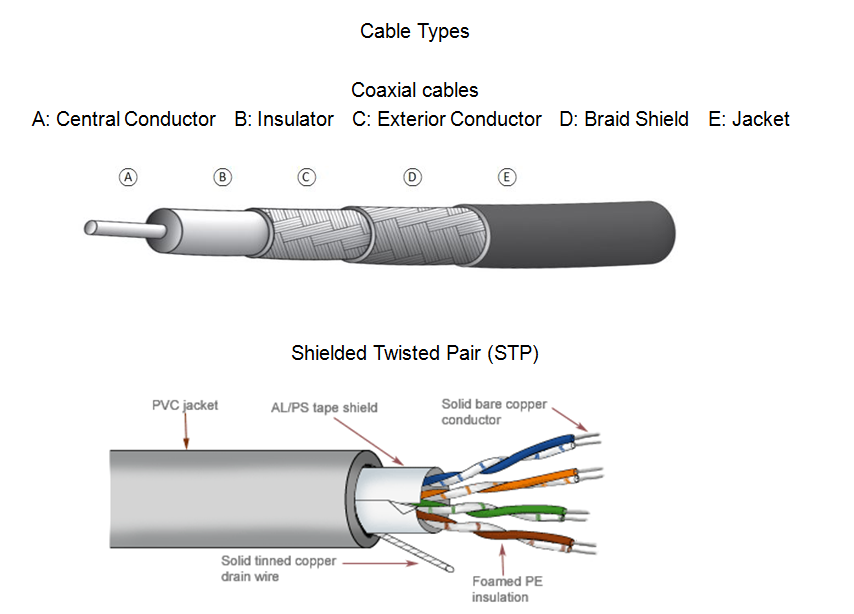
With the transformation from single conductor cables to twisted pair cables or even Coaxial cables. All of the above aim to lower autonomous interference and increase resistance towards foreign interference; however, due to multiple wires or multiple signal pairs during high speed transmission the possibility of Crosstalk has also increased; hence, the cause of Crosstalk must be analyzed and examined.
Crosstalk is any phenomenon by which a signal transmitted on one circuit or channel of a transmission system creates an undesired effect in another circuit or channel. Crosstalk is usually caused by undesired capacitive, inductive, or conductive coupling from one circuit, part of a circuit, or channel, to another. An example is when we use our landline phones at home there would sometimes be interference where a third voice or radio sounds could be heard during phone calls; thus, high frequency transmissions are prone to Crosstalk from neighboring high frequency transmissions; hence, it would be extremely difficult to avoid Crosstalk from accruing. That is why we require Crosstalk testing to determine and understand weather the Crosstalk is within acceptable ranges.
Crosstalk can be divided into two types Near End Cross Talk-NEXT & Far End Cross Talk-FEXT, currently Type-C has 4 signal pairs and DisplayPort has 5 AUX control signal pairs, the extra signal is used for audio. Hence, both Validations take Crosstalk perimeter measurements seriously and have included them into their respected testing criteria’s.
Signal Loss
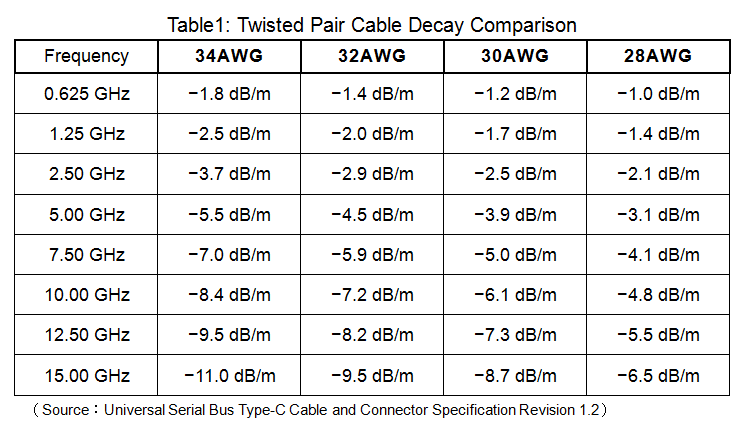
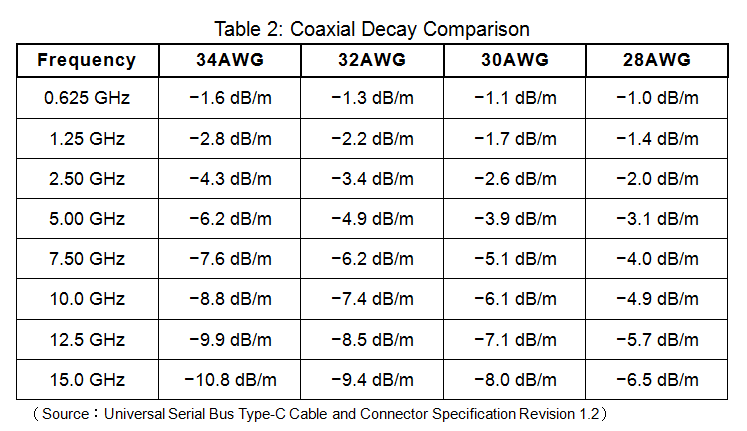
With the trend of products becoming smaller the corresponding need for light weight twist cables has grown, thus making the cable thinner. At this moment HDMI cables are around 24-30 AWG, USB 3.1 are 28-34 AWG. When cables become thinner the signal that is sent may fatigue due to the properties of copper. USB-IF has set a standard for accepted rates of fatigue shown below. ( table 1 & table 2 )
“Loss” is defined by the fatigue during transmission, which can be categorized in to two types: Insertion Loss & Return Loss. In an ideal situation there should be no fatigue; however, due to the unique properties of copper the further the cable span the higher the fatigue rate (or the larger the cable the more fatigue). Although this sort of fatigue does not affect the connector, however it may cause serious problems to the cable. The generation of reflective loss is caused by the connector or the paring interface, the main reason for this is the shape of the connector and uniqueness of the “structure” for the connector, also during the manufacture of the connector certain flaws would also hinder its performance. In order to obtain a better grip and increase the quality better testing for high frequency connectors is a must.
Cable Insertion Loss testing requires instruments to perform detailed testing. Normally testing these Insertion Loss requires equipment for testing Time domain & Frequency domain. In the case of USB 3.1 Time Domain Reflectometry, (TDR) & Network Analyzer, (NA) are used to measure different parameters. The increase of transmission speed also poses multiple challenges regarding the integrity of instruments required and initial investment needed to fulfill the tasks.
For USB 3.1 Type-C the proposed MOI (Method of Implementation) requires cable testing to be performed via one single cable testing unit. At this point both (TDR) & (NA) can be completed on one testing unit. On Tektronix (TDR) measurements can be converted via IConnect software with Fast-Fourier Transform into sin waves of various frequencies. The Keysight ENA uses option (TDR) to convert sin waves measured into Inverse Fourier Transform Time Domain signals.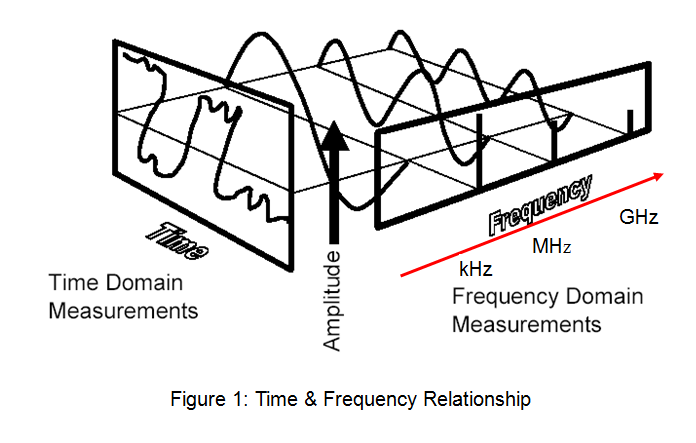
The increased demand for slimmer and faster connectors has shrugged off contemporary methods of manufacturing, into micro-components and higher frequencies. Testing and analyzing connectors requires a large commitment of capital and labor. The connectors mentioned in this review are still considered as lower tier products. However the study of high frequency technologies has formed a barrier within the industry; hence, upgrading the overall ability of high end products such as, board to board connectors has become a final barrier for all connector manufactures.
With the support from software to convert signals engineers can measure both (NA) & (TDR) at the same time, hence reducing time needed to fulfill tests, lowering costs and analysis time.