


Many people use smartphones to play music or record sounds. Due to the fast pace of technological change and fierce competition, consumers have high expectations of smartphone audio performance. Audio tests are usually subjective, but Allion applies objective laboratory methods to detect differences in smartphone audio quality.
This is the third article in our Smartphone User Experience Analysis series and the first article to focus on Audio performance. This article describes audio input testing that we performed as part of a competitive analysis of several smartphones. These smartphones (DUTs) are listed by column in the table below.
Devices Under Testing (DUTs)

We divided our audio tests into two categories:
- Audio Input Testing measures the audio quality from digital signal to analog signal (D/A), including headphone jack, amplifier and speaker
- Audio Output Testing measures the audio quality from digital signal to analog signal (D/A), such as built-in microphone or headphone microphone jack.
Test Items

For further test item definitions, please read Capacitor Products – Audio Quality Analysis (I) – Standard Testing.
Audio Output Testing
Test Instrument:
- Audio Precision APx585 + AP500 v4.2
- 10K Ohm Loading (Analog back-end amplifier of the dummy load)
Test Setup:
Used smartphone to play audio file and then connected the Audio Precision APX585 test instrument though 3.5 mm cable with 10K Ohm loading. Allion will make the comparison based on the data provided by the Audio Precision test instrument

Figure 1 : D/A Test Setup
1. D/A – Full Scale Output Voltage and THD+n Ratio
Test Purpose:
This test item measures maximum output voltage. If the distortion exceeds 1% of the original signal, the sound waves are usually truncated, which makes for a poor listening experience.
Test Setup:
The common setting of this test item was to play 0 dBFS file and output voltage required more than 300 mV. This result established a reference maximum distortion value that was used in subsequent tests.
Suggestion Criteria:
Distortion rate less than 1% and has more than 300 mV output voltage.
Test Signal:
0 dBFS / 1 kHz, 44 kHz 16 bit PCM Wav

The test results showed that the iPhone 6 and Android Phone 2 had higher voltage (more than 1 V) at 1 kHz; meanwhile, these two smartphones had lower distortion. Android Phones 1 and 3 had similar distortion rates, but the Android Phone 3 had greater output voltage.
Rank: iPhone 6 > Android Phone 2 > Android Phone 3 > Android Phone 1
2. D/A – THD+n Amp. vs Frequency
Test Purpose:
To examine the amount of output distortion over the full frequency range.
Suggestion Criteria:
In the full frequency range (20 Hz – 20 kHz), values should be ≦ -65 dB.
Test Signal:
We used 44 kHz and 48 kHz sampling audio files to test. 44 kHz is the common sampling rate for audio testing. We tested 48 kHz audio samples because we used it to find resampling errors in Android systems, which resulted in too much distortion and attenuation.
When we played the 44 kHz sample audio file, the iPhone 6 and Android Phone 2 had -85 dB to -90 dB of distortion in the middle and high band frequencies. But in the low band frequency, the Android Phone 2 produced more distortion than the iPhone 6. On the other hand, the Android Phone 3 had the poorest performance among the DUTs because its distortion was higher than -80 dB in full frequency mode.


When playing the 48 kHz sampling audio file, the distortion performance was very similar to the 44 kHz results and no resampling errors occurred in any of the DUTs.


Rank: iPhone 6 > Android Phone 2 > Android Phone 1 > Android Phone 3
3. D/A – Dynamic Range
Test Purpose:
To measure the distance between the reference signal and noise at 1 kHz frequency. This test shows the total amount of noise between the DUT and its surroundings.
Suggestion Criteria:
Value≧ 85 dB ( The ideal value for a 44 kHz 16-bit sample is 96 dB).
Test Signal:
-60 dBFS (weak signal) 1 kHz 44 kHz 16-bit PCM WAV
Most DUTs had results above 90 dB, except for the Android Phone 1. The iPhone 6 and Android Phone 2 were closest to the ideal value (96 dB), which is the maximum dynamic range of 16-bit audio. In the figure below, CH1 represents the left channel and CH2 represents the right channel.

Rank: iPhone 6 > Android Phone 2 > Android Phone 3 > Android Phone 1
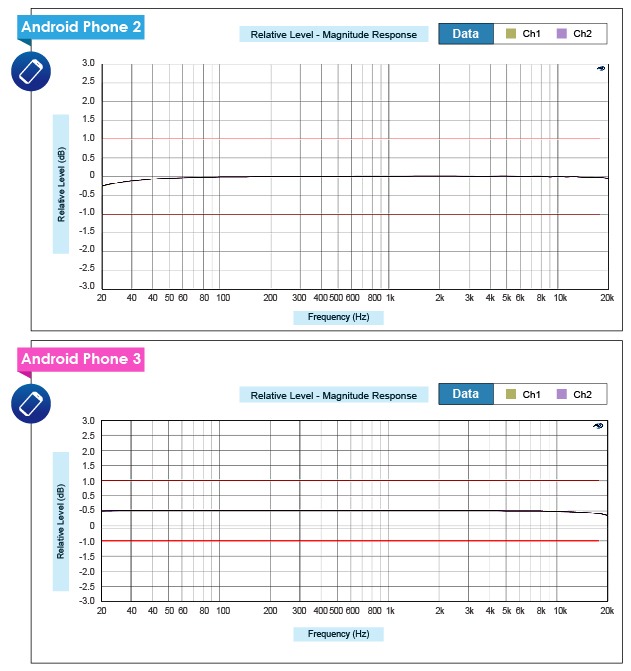
4. Frequency Response
Test Purpose:
To examine the attenuation of output and original signals in the full frequency range.
Suggested Criteria:
- Low/High frequency attenuation cannot go over ±1 dB.
- The middle area of the curve cannot fluctuate more than ± 0.25 dB.
Test Signal:
- Input signal with -20 dBFS (20 Hz – 20 kHz Sweep)
- Sampling audio file with 44 kHz and 48 kHz 16-bit PCM WAV
With the 44 kHz sampling audio file, the Android Phone 1 test results were a straight line, which indicates good performance. The rest of the curves looked smooth in the middle section of the graph, but the iPhone 6 had a tiny amount of attenuation at 20 KHz. The replay capability of Android Phone 2 could reach 19 kHz, but the Android Phone 3 only supported 17.6 kHz, meaning that it had the worst performance.


When we played the 48 kHz audio sampling file, DUT performance was quite similar. All the test devices performed well in full frequency replay with no resampling error.


Rank : Android Phone 1 > iPhone 6 > Android Phone 2 > Android Phone 3
5. D/A – Crosstalk vs Frequency
Test Purpose:
To examine the ratio of stereo signal with no sound at full frequency and the other channel with sound at full frequency. This ratio will reveal if any crosstalk is occurring between channels. If crosstalk occurs between the two stereo signals transmitting different messages, it will degrade the audio quality by interfering with stereo transmission, soundstage, and positioning.
Suggestion Criteria:
The value should≧50 dB. (absolute value)
We used two checkpoints for this test item; the first being the standard checkpoint of 10 kHz and the second being the worst performance checkpoint. Our measurements show that the Android Phone 2 performed best, with nearly -80 dB at full frequency. The Android Phone 1 remained under -75 dB and the iPhone 6 reached a level of -70 dB. The Android Phone 3 scored worst at around a 60 dB level.


-13")


Rank: Android Phone 2 > Android Phone 1 > iPhone 6 > Android Phone 3
6. SPK- Full Scale SPL vs Frequency
Test Purpose:
To test the speaker capability to revert to normal signal.
Test Signals:
100 Hz – 15 kHz, 0 dBFS, 44 kHz 16 bit Wave
SPK test instrument: TES-1357 sound level meter
Test Environment:
We conducted this test in a quiet room with an ambient noise level of 38 dBspl. Measurements were made at intervals of 1 second (Slow) and an A-weighted value was deducted from each reading. We played 23 different audio file frequencies at maximum digital signal (0 dBFS) and used the TES-1357 sound level meter to measure the audio pressure at each frequency.
During the test, the sound level meter was just 10 cm away from the DUT speaker. This allowed us to measure the sound directly without interference or echo effects. Some DUTs had two built-in speakers. In order to be fair, all the measurements focused on the sound quality of a single speaker.

Figure 2: Sound Pressure Level (SPL) Test Setup (Fast Setting means the sound level meter will record values at 100 ms intervals)
Our measurements show that the Android Phone 2 had less attenuation at high frequencies and that its performance in low frequencies was close to the iPhone 6. Hence, the Android Phone 2 performed best on this test. The sound pressure performance of the iPhone 6 and Android Phone 3 were quite similar. The Android Phone 1 showed the worst performance, especially at high frequencies .

Rank: Android Phone 2 > iPhone 6 > Android Phone 3 > Android Phone 1
Conclusion
In the summary table below lower scores indicate better quality. This table shows that the iPhone 6 performed best. Android Phone 1 had poor performance on distortion and background noise, while the Android Phone 3 did performed poorly on all the tests. In contrast, the Android Phone 2 performed slightly worse than the iPhone 6 overall.
Our next smartphone testing article focuses on audio input testing. Stay tuned to this channel for the next installment in the series! If you missed any of the previous articles in this series, you can find links to them in the Related Articles section below.

Related Articles:
Smartphone User Experience Analysis – Display
Smartphone User Experience Analysis – Camera