It is difficult to find information about smartphone audio input testing because the techniques are so uncommon and complicated. Since Allion has conducted audio testing for many years, we have accumulated a body of knowledge and practical experience in audio input testing, including testing of headphone input jacks and built-in microphones. In this article, we present our audio input test methods and some sample test results based on some recent test data.
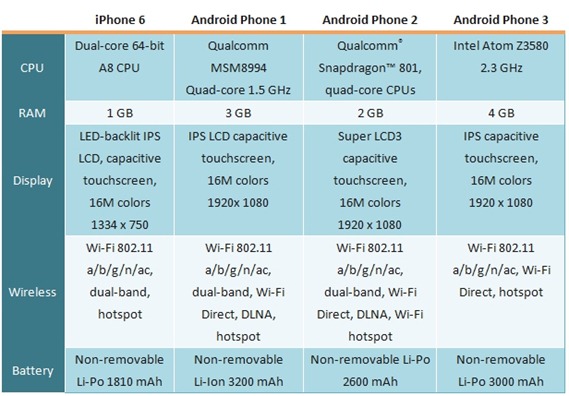
This is the fourth article in our Smartphone User Experience Analysis series and the second article to focus on Audio performance. This article describes audio input testing that we performed as part of a competitive analysis of several smartphones. These smartphones (DUTs) are listed by column in the table below.
Devices Under Testing (DUTs)
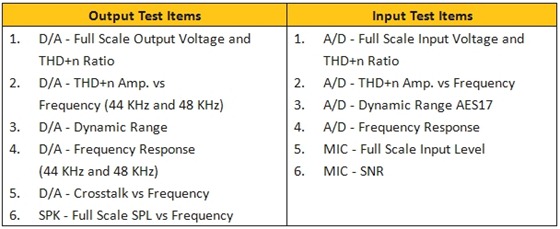
We divided our audio tests into two categories:
- Audio Input Testing measures the audio quality from analog signal to digital signal (A/D), such as built-in microphone or headphone microphone jack.
- Audio Output Testing measures the audio quality from digital signal to analog signal (D/A), including headphone jack, amplifier and speaker.
Test Items
For further test item definitions, please read Capacitor Products – Audio Quality Analysis (I) – Standard Testing.
Audio Input Testing
Test instrument:
· Audio Precision APx585 Audio Analyzer + APx500 Audio Test Software (v4.2)
· 3RCA to 3.5 mm adapter (+1.0-1.5 kW loading to activate headphone jack)
· The Sound Recorder by WinMob 1.81803.0 Apps
Test Setup:
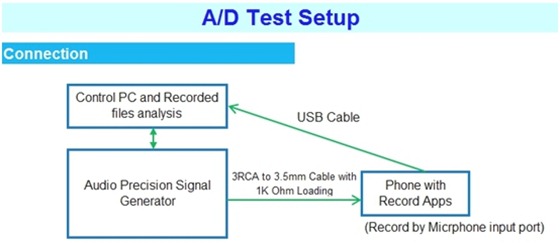
We used the signal generator to generate an analog signal and sent it through the 3RCA to 3.5mm adapter (+1.0-1.5 kW loading) to the smartphone headphone jack. We also set the sound recording format (PCM, 44 kHz, 16 bit, mono channel) and started recording. After recording, we sent the audio file via USB cable to the Audio Precision APx585 for further analysis. You can see the test setup schematic below.
Figure 1 : A/D Test Setup
In fact, it was difficult to activate the audio input function because it was often affected by the circuit loading or by interference with the built-in microphone. Only the research team for each smartphone model knew the correct variables to activate the audio input function. As a result, our team spent a lot of time and effort to determine the correct variable settings for each smartphone. Eventually, we succeeded in activating the audio input function on every smartphone in this test.
1. A/D – Full Scale Input Voltage and THD+n Ratio
Test Purpose:
This test measured the analog signal voltage at which the recording signal level reached 0 dBFS. This voltage was used as a reference point in subsequent testing.
Suggestion Criteria:
Recording level must be close to 0 dBFS.
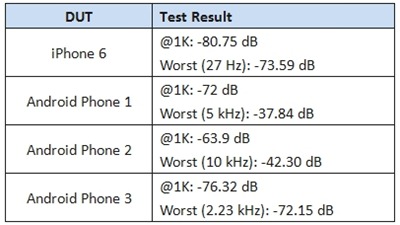
In this test, we learned what input voltage was required to achieve a maximum signal level and the associated distortion rate, as shown in the results below.
As shown above, only the iPhone 6 and Android Phone 3 achieved a 0 dBFS signal level. Android Phone 3 only required 13 mV to return the maximum signal level, which seems to indicate better microphone sensitivity than the iPhone 6. For Android Phones 1 and 2, no matter the applied input voltage, the signal level always remained over -1 dBFS. Android Phone 3 also exhibited the least distortion, which is why it was the top performer on this test, as shown in the rankings below.
Rank: Android Phone 3 > iPhone 6 > Android Phone 2 > Android Phone 1
2. A/D – THD+n Amp. vs Frequency
Test Purpose:
To examine the amount of input distortion over the full frequency range.
Suggestion Criteria:
In the full frequency range (100 Hz – 20 kHz), values should be ≦ -65 dB
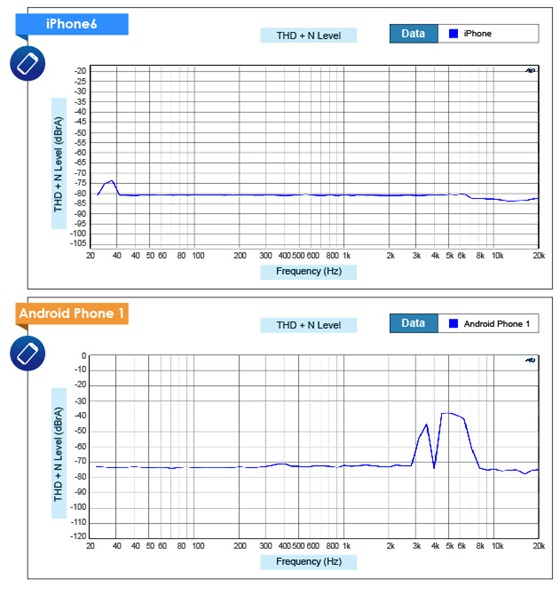
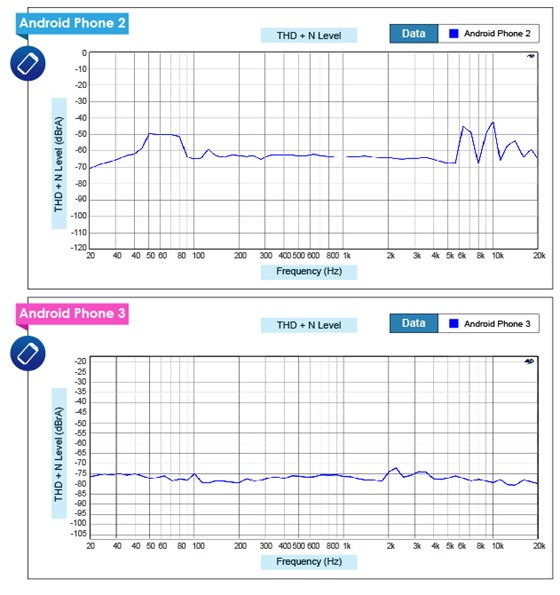
From our test results, it seemed that the iPhone 6 had some noise in the lowest frequency bands, while the higher frequencies had less than -80 dB of distortion. Input distortion for the Android Phone 3 was between -70 dB to -80 dB. Android Phones 1 and 2 had similar distortion profiles over the full frequency range, except that the Android Phone 1 showed less distortion at lower frequencies. As shown in the graphs below, these two Android smartphones performed best in the middle frequency bands. The iPhone 6 was the clear winner in this test, followed by the Android Phone 3, as shown in the relative test ranking below.
Rank : iPhone 6 > Android Phone 3 > Android Phone 1 > Android Phone 2
3. A/D – Dynamic Range
Test Purpose:
To measure the distance between maximum signal level and noise at 1 kHz.
Suggestion Criteria:
The value should >= 70 dB.
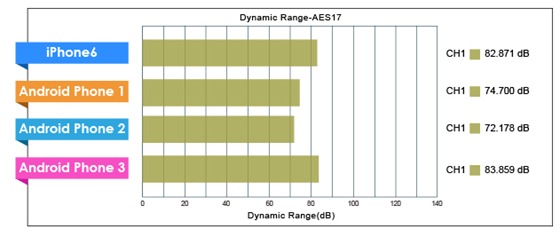
The iPhone6 and Android Phone 3 had over 80 dB of dynamic range, while the Android Phones 1 and 2 had less dynamic range, as shown in the graph below.
Rank: Android Phone 3 > iPhone 6 > Android Phone 1 > Android Phone 2
4. Frequency Response
Test Purpose:
This test measures signal attenuation over the full frequency range.
Suggestion Criteria:
· Lower band (≤ 200 Hz) attenuation ≤ 3 dB.
· Higher band (≥ 8 kHz) attenuation ≤ 1 dB.
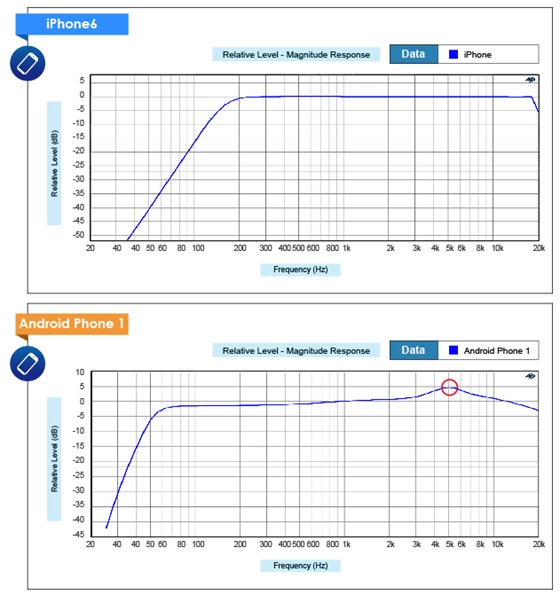
Generally speaking, a wider frequency range with minimal attenuation is best. However, each vendor has their own priorities. For instance, some smartphones minimize attenuation only in the middle bands for human voice recording.
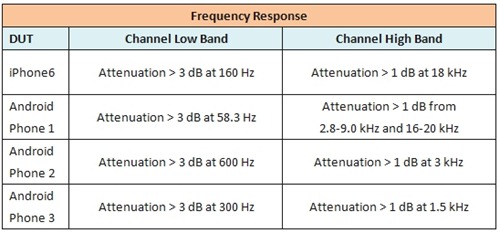
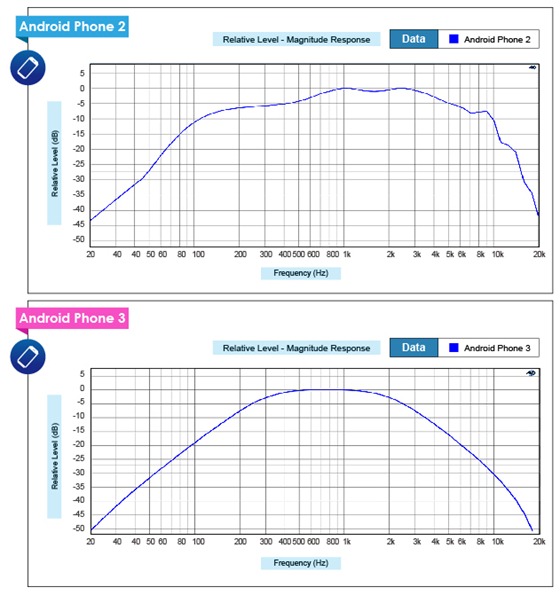
The iPhone 6 had attenuation over 3 dB below 160 Hz and over 1 dB above 18 kHz. Android Phone 1 had good performance, with just a small fluctuation at 5 KHz.
Android Phones 2 and 3 met the suggested attenuation criteria over just a very narrow frequency range. These smartphones can record regular speech, but not music or other high-fidelity sounds.
Rank: iPhone 6 > Android Phone 1 > Android Phone 2 > Android Phone 3
5. MIC- Full Scale Input Level and SNR
Test Instruments:
· Audition 1.5 Audio Edition Software
· Larson Davis CAL200 Standard Audio Source
· Windows Mobile Sound Recorder App
Test Setup:
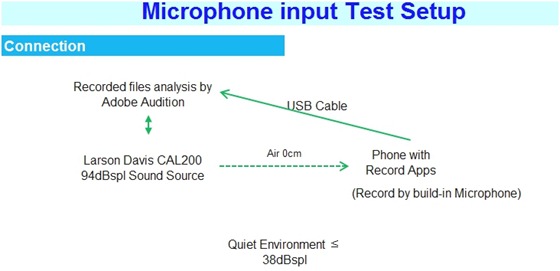
First, we recorded a 94 dBSPL standard sound pressure with the built-in microphone. We used Adobe Audition software to analyze the recorded signal levels. In this way, we could compare the microphone sensitivity of each smartphone. Using this data, we calculated the Signal to Noise Ratio (SNR) for each smartphone.
As shown in the MIC Test results below, the Android Phone 2 had a higher signal level, but its background noise was also higher than the iPhone 6. Since the standard signal level is -20 dBV, the iPhone 6 seems to have better performance. Android Phones 1 and 3 had lower signal levels, which would be useful for recording lower frequency sounds. In the end, the Android Phone 2 and iPhone 6 had higher SNR values, which means that their built-in microphones performed best.
Rank: iPhone 6 > Android Phone 2 > Android Phone 3 > Android Phone 1
Conclusion
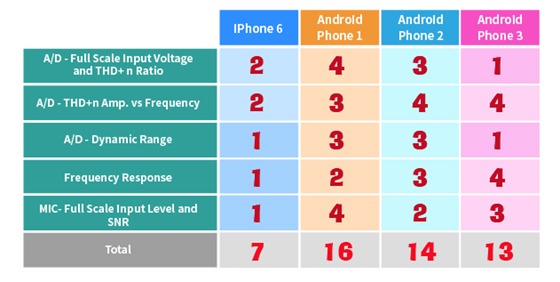
Audio tests are usually subjective, but Allion applied objective laboratory methods to detect differences in smartphone audio quality. The overall test results are shown in the summary table below. In this summary table, lower scores indicate better quality. As you can see, the iPhone 6 outperformed the competition with a score of 7. The Android Phones showed similar overall performance, although Android Phone 3 was competitive with the iPhone on the first and third tests.
Our next smartphone testing article focuses on touchscreen input. Stay tuned to this channel for the next installment in the series! If you missed any of the previous articles in this series, you can find links to them in the Related Articles section below.
Related Articles
Smartphone User Experience Analysis – Display
Smartphone User Experience Analysis – Camera


