


In this article, we’ll start discussing more in-depth the practical applications of the SNIA PTS.
It’s usually a headache for users and OEM manufacturers to choose a reliable SSD with stable performance. With the SNIA PTS, detailed results of SSD performance and characteristics such as stability, response time, and others can be analyzed. The SNIA PTS can obtain the general indicators used to determine the quality of SSDs. After testing, we can retrieve the SSD data results and evaluate the SSD. Although the SNIA PTS test procedures are a bit complicated, it can still efficiently test the SSD performance.
Next, we’ll discuss the performance data and weak points of an SSD with real test data. A Gen 4 NVMe SSD from a mainstream brand was used for this test and went under three basic SNIA PTS tests, namely SNIA IOPS, SNIA TP (throughput), and SNIA LAT (latency).
With these three basic tests, we can effectively determine the performance quality of an SSD.
1. SNIA IOPS
The SNIA IOPS test evaluates random read and write performance such as various R/W and block size combinations that most users commonly use. Under PTS Steady State, 7 read/write combinations (from 100% read to 100% write) and 8 block sizes (from 0.5 KB to 1024 KB) are tested.
After the test is done, users can quickly retrieve data with the tables and 3D charts provided in the SNIA test report. We only selected a few tables to discuss the IOPS performance of this particular SSD due to the large amount of results.
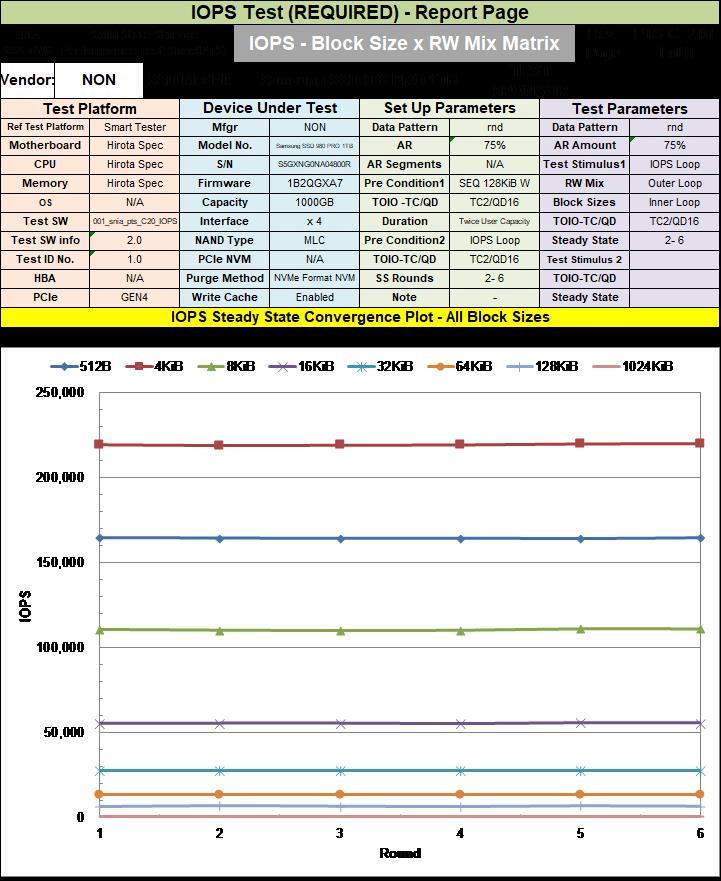
From the IOPS mix matrix table, it can be seen that this SSD has stable performance in various block sizes and performs well with 4 KB.
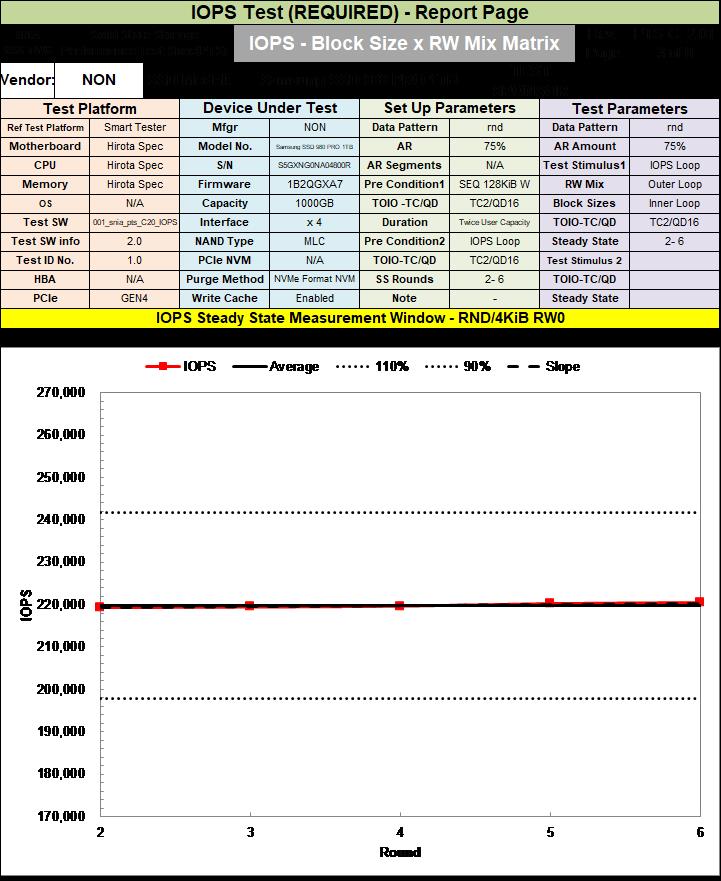
This table is used to calculate the slope when entering Steady State. It can be seen that this tablet is stable when entering Steady State during each of the 5 test rounds. The IOPS of the red line and the average of the black line are almost identical. Although it only started being stable in rounds 2 to 6, it’s still considered to be a good-quality performance.
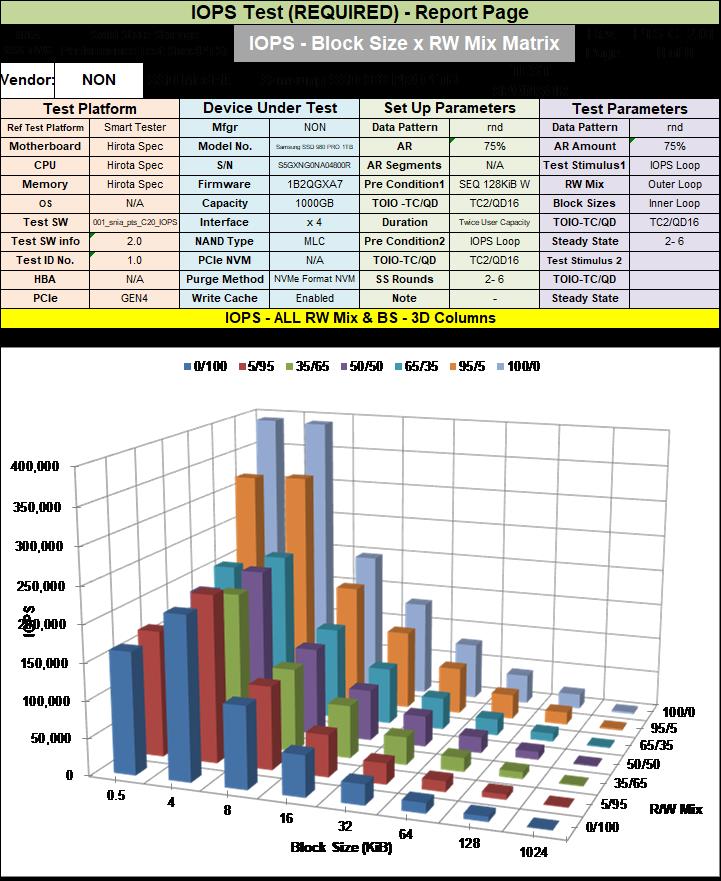
Lastly, the 3D graph shows all read/write combinations. With this 3D graph, we can see the performance of various block sizes and read/write ratios. It can be seen that this SSD has stable performance. The performance is best at 4 KB, especially 4 KB write.
2. SNIA TP
The SNIA TP test utilizes 100% read and 100% write to perform I/O measurements with large block sizes under PTS Steady State. The SNIA TP test results are similar to that of SNIA IOPS. The data is retrieved through the data table and 2D chart in the test report. We also selected a few tables to discuss the TP performance of this particular SSD due to the large amount of results.
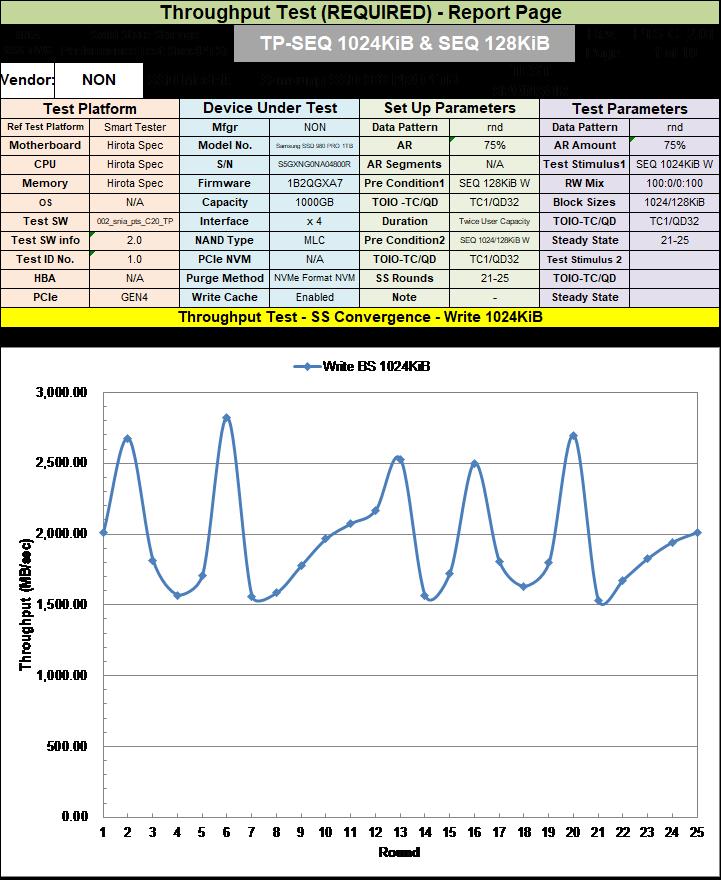
It can be seen in the table above that the throughput performance of this SSD is unstable with major fluctuations. It could not reach a stable state after a maximum of 25 test rounds. Also, the write throughput stability at 1024 KB is not good.
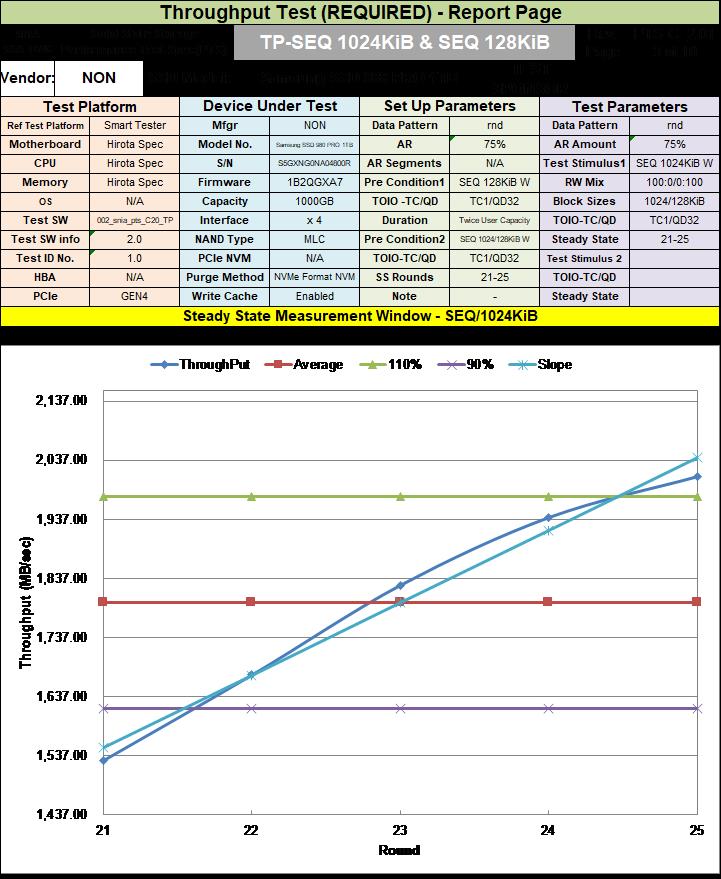
This table is used to calculate the slope when entering Steady State. It can be seen the slope has exceeded the 10% range above and below the defined value, showing an unstable pattern. It can also be seen that the slope line has exceeded the 10% range above and below the average value.
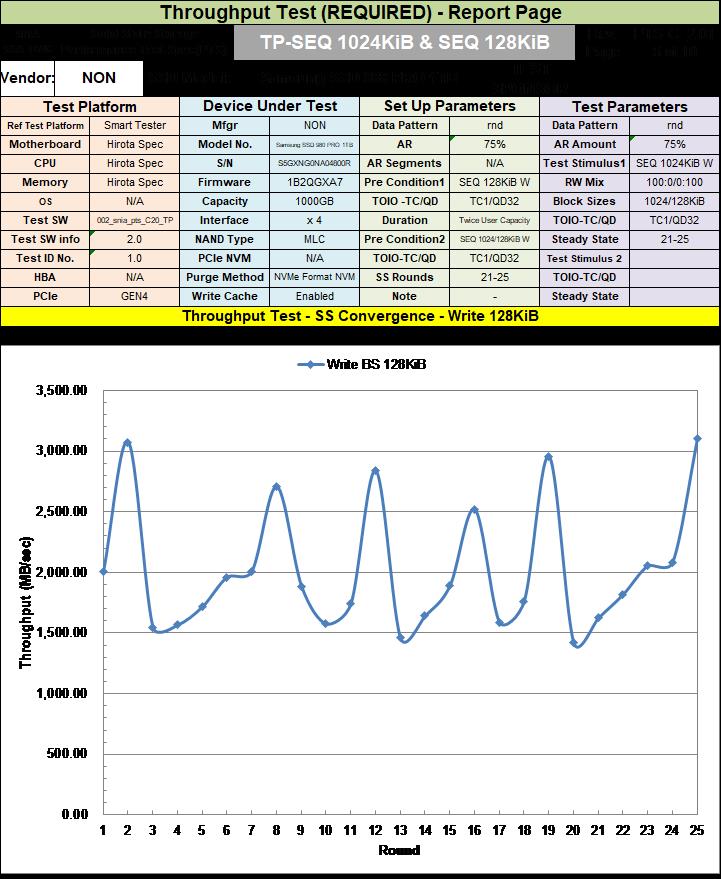
It can be seen in the table that for 128 KB write, the throughput performance is just as unstable as the performance at 1024 KB with major fluctuations. It could not reach a stable state after a maximum of 25 test rounds.
3. SNIA LAT
The SNIA TP test performs random I/O measurements with specific block sizes and read/write combinations under Steady State to measure the average and maximum latency. Latency test results can also be retrieved through the data tables and 2D charts in the SNIA test report. We’ve selected several tables to discuss the performance of this SSD’s LAT.
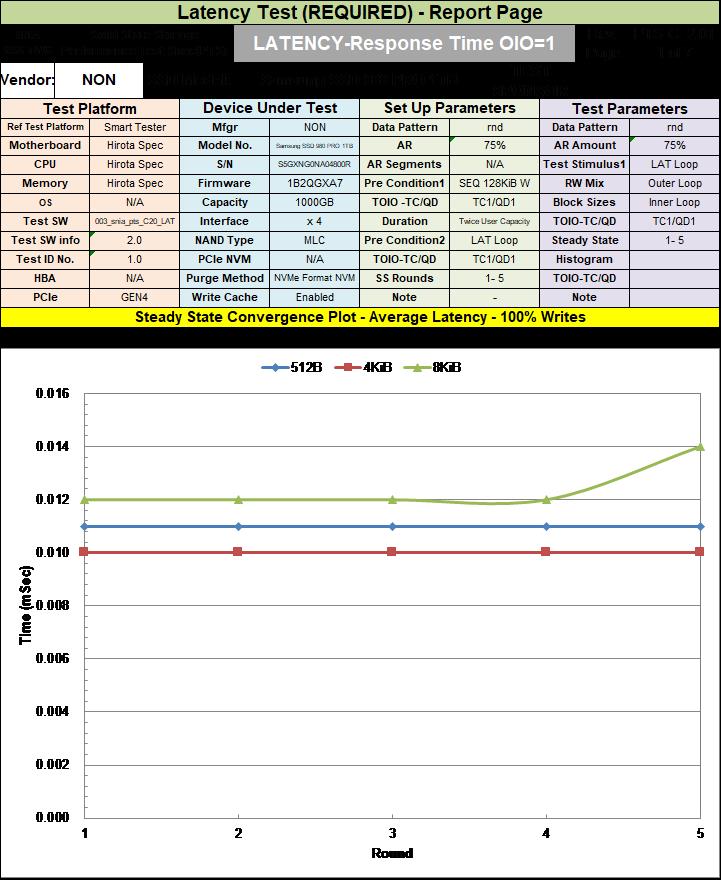
First, let’s look at the average latency values. It can be seen that the overall performance is stable even though the 8 KB block size gets slightly higher in the 5th round. Also, there is no sudden increase or decrease in latency time.
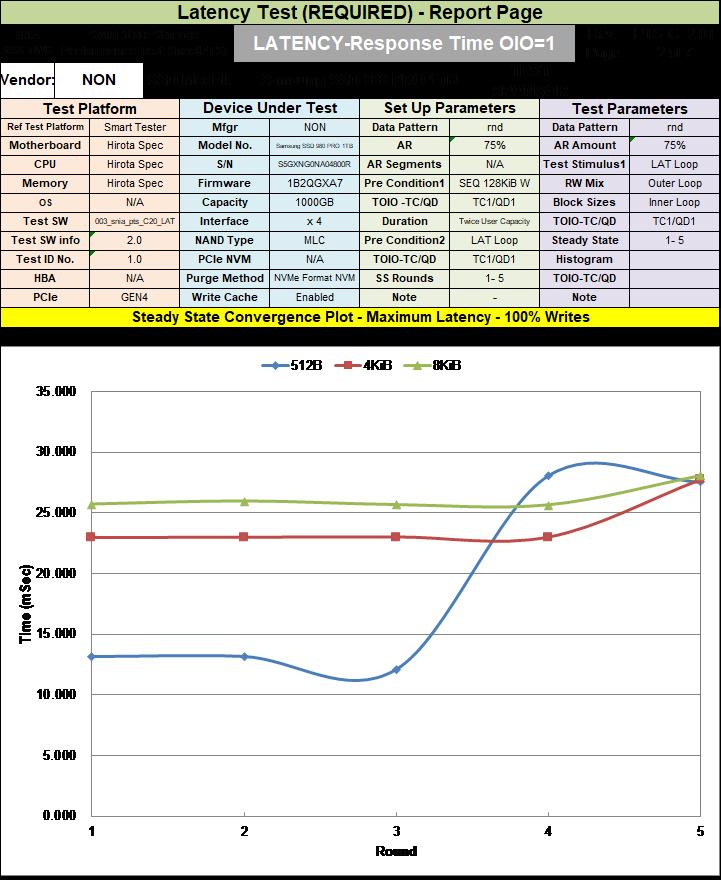
Next, let’s observe the maximum delay time. It was found that there was an increase in the 4th and 5th rounds with 512 bytes. The performance was relatively stable in 4 KB and 8 KB.
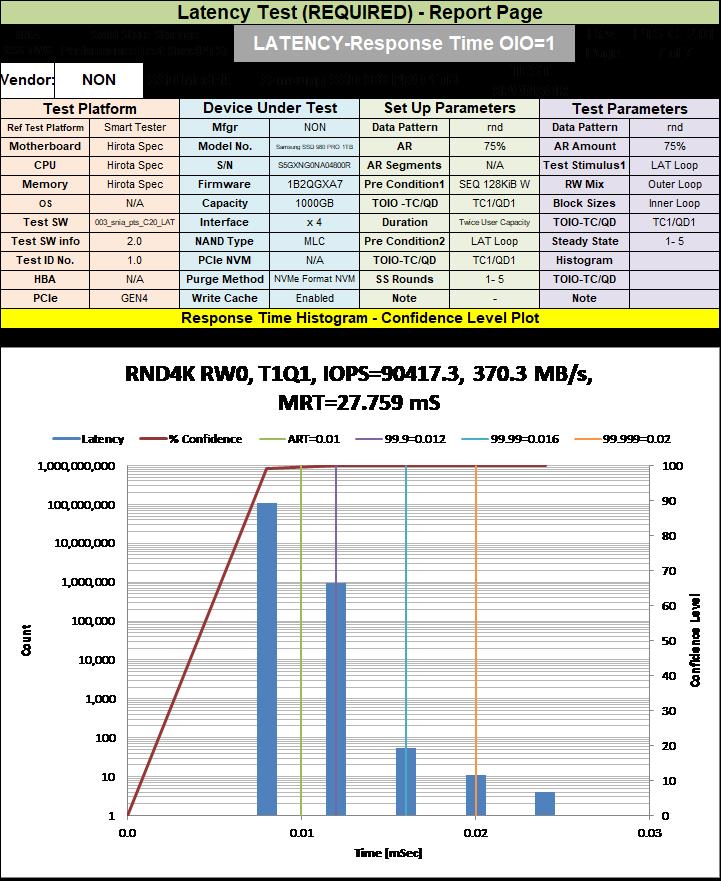
Lastly, the confidence interval table shows the percentage of all latency times in a specific time. For example, you can tell at which time 99.9% of IO occurs. A higher percentage means that more IO can be completed faster and considered to be a better result. This means that the SSD can handle IO operations more efficiently with better performance, pointing to a superior testing performance.
In this article, we discussed the IOPS, TP, and LAT of the SNIA PTS with actual test measurements that analyzed SSD performance. Although the SSD has stable performance in the IOPS test, the TP test showed that the throughput was unstable. The throughput value fluctuated significantly during 128 KB and 1024 KB. During actual usage, users will feel the performance becoming unstable after long-term use, especially with writing. Although this won’t affect normal users as much as high-pressure reading/writing server applications, unstable throughput can seriously affect server performance and should be dealt with with care.
Allion has a complete range of server testing environments and equipment for SNIA PTS. We can provide complete test reports and give clients comprehensive suggestions based on our rich testing experience.
Simultaneously, we can verify product quality with our clients’ products according to their needs. With our professional testing solutions, clients can discover potential issues early in the process, building a solid foundation for future product revisions and updates.
If you have any further needs for testing, verification, or consulting services related to the server ecosystem, please feel free to contact us through the online form.