With the dazzling appearance of ever more sophisticated, cheaper and cool smart phones many providers are faced with the unprecedented challenge of churning up ever more sophisticated devices, to satisfy the unquenchable thirst of our gadget addicted society.
Naturally we look towards our surrounding tech gurus or nerds for inspiration, especially when our pockets are involved. Yet, instead of a prejudice overview we are bombarded with an objective view from their personal experience. Here at Allion we examine each product with an omnipotent perspective; starting from 2015 we have routinely published “The smart phone user experience” as a pinnacle towards the review of various smart devices. With state of the art equipment to examine the display, camera, acoustics and GPS functions, with exceptional reviews from our readers.
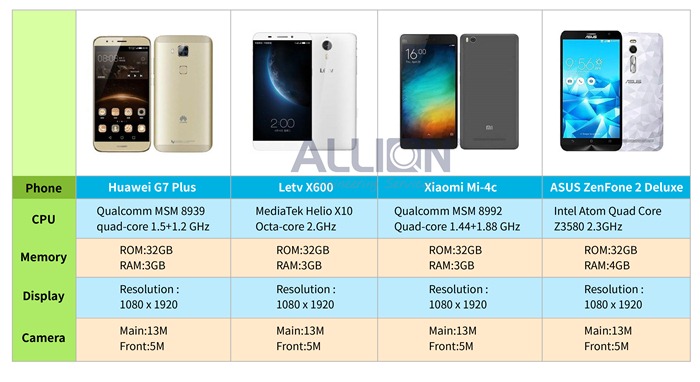
For this review our study group has chosen 4 upcoming high-end smart phones for a review and Competitive Analysis; this not only helps producers better understand their products, but also has a definitive effect on market placement and SWOT analysis. Through this we at Allion are able to locate possible flaws and provide optimal solutions for our clients.
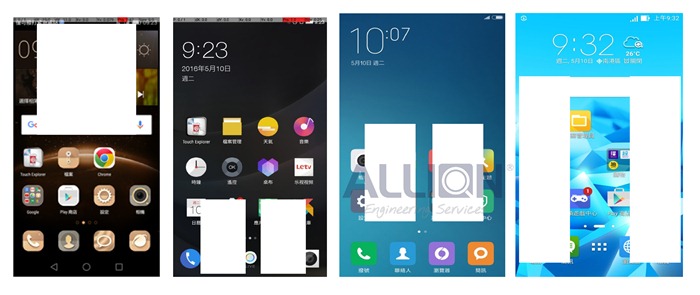
There are the 4 phones under review, for convenience the following would refer to them as P1-P4, for further inquiries please contact Allion.
Display Review
For this segment we include brightness, contrast, color temperatures, gamma, color space, blue light, etc. For more info please refer to the “smart phone user experience analysis for displays”. Our study group has chosen three criteria’s for examination: brightness, gamma, blue light.
- Brightness
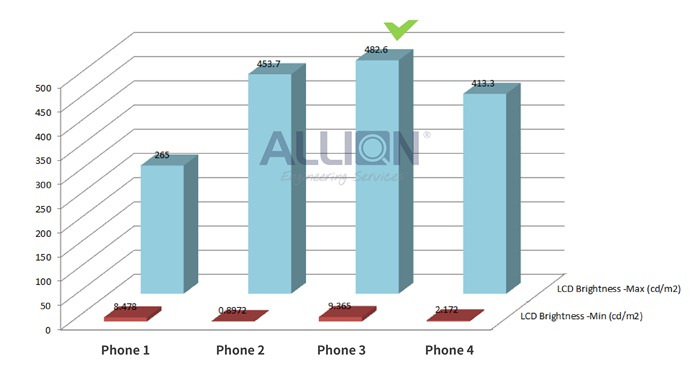
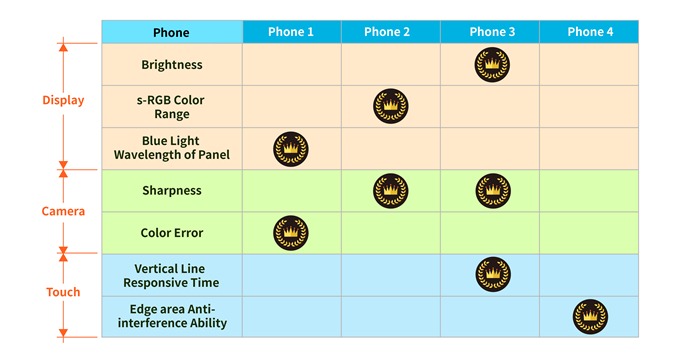
The higher the standard evaluation for this category, the brighter backlight requirements are. Also the higher levels of light allow for better visibility brightness under the sun. Many bloggers would test their phones by taking actual photos. However, here at Allion we decided to bring out the big guns. Introducing the KONICA MINOLTA CA-310 Color Analyzer and KONICA MINOLTA CS-1000A/S/T Spectroradiometer. The tests were conducted in a dark room, also by quantizing the statistics we are able to better understand differences in the product. During this evaluation P3 had the most optimum performance. P1 had the lowest lighting performance compared with others. P3 Also had the largest backlighting adjustability.
- Color Gamut s-RGB Color Range
Using color triangle as a standard and black as the test range; hence, the values closest to (sRGB 100%) the better. In other words, better saturation. A fully saturated display opts for a more enjoyable and vivid display for the user. If all phones were placed out in a row this would be even more obvious. With this in mind P2 has a better performance in saturation.
- Blue Light Wavelength of Panel
A desirable LCD optimization would be one that allows for adjustment for Blue Light Wavelength. Some providers would adjust the display to a bluer tone to make the display seem more saturated. With advances in visual study, we realize that blue light may cause long term damage to the user’s optics. At Allion we also have tests for Blue Light Wavelength. For providers of Smart Phones this may play a vital benchmark for consumers in their choice for a Phone. Blue Light Wavelength under a Spectrophotometer would be represented as Blue peaks. As can be seen in the chart below P1 has the best control of the four phones.
Camera Evaluation
Main stream Smart Phones today are equipped with cameras of a million pixels or more. In terms of hardware there is not much room for improvement, but from this there are numerous extensions and benefits with such a powerful “weapon”. Allion provides an array of Camera Certifications, for more details please refer to Smartphone User Experience Analysis – Camera, the focus of this article would be to examine Sharpness and Color Error. The former would affect quality and dimensions of the image and the later would cause viewing issues with the user.
- Sharpness
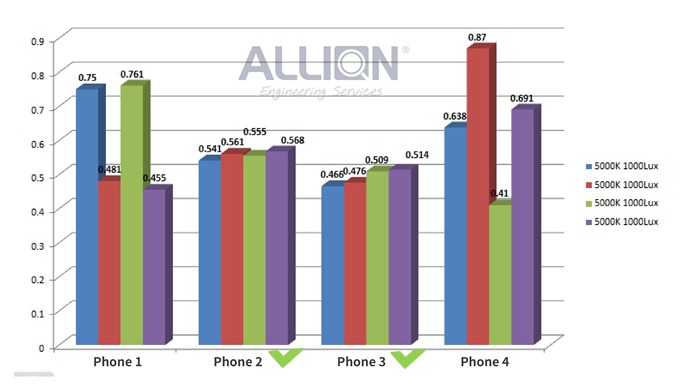
We have discussed Sharpness tests in previous articles using SFR Plus Standard Chart for Optical statistical analysis; which, provides a neutral validation of MTF lens standard. Below the environment was set between 5000K / 1000Lux and the assessment standard was determined via highest MTF. In short P2 and P3 performed evenly with a higher overall performance.
- Color Error
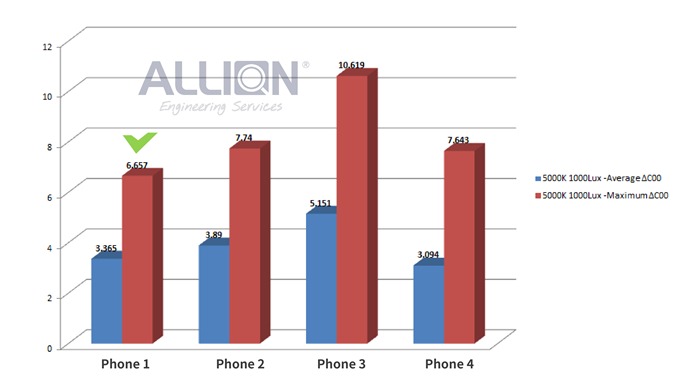
From Macbeth Standard Chart analysis, we know the closer the margin between the statistics the smaller the color Error; hence, the more realistic the image would be. The most common form of Color Error would be, blue colored objects showing up as purple.
The following is an environment set under 5000K, the margin between all phones shows P1 to have the closest margin; the lowest Color Error.
Touch Screen Analysis
The spectrum for touch screen analysis is extremely broad; weather its scrolling up or down, multi-touch or sliding tests, etc. Allion is capable of performing a wide array of resistance tests for touch interference. Surprisingly, we are one of the very few on the market able to perform these tests. Mainly because these tests require finely tuned and professionally calibrated equipment; however, most importantly a lab dedicated towards performing these tests. In the following four smart phones will undergo “Hot Zone”, vertical touch and simulated interference quality test comparisons. For more please go to: Smartphone User Experience Analysis-Touch.
Allion is capable of calibrating numerous operating configurations, the following (fig) shows 6 red lines splitting the display into 4 zones for examining the quality of the interaction between device. Performance will be measured via “Hot Zone” response (best), “Edge Zone” response (lowest).
- Interaction quality “Hot Zone” and response time
There are no set criteria’s for evaluating “Hot Zone” and “Edge Zone”, these are mainly based on the requirements and configuration of the touch display panel provider and its respective features. The white zones are the “Hot Zones” for this test and would be the most sensitive regions for user response.
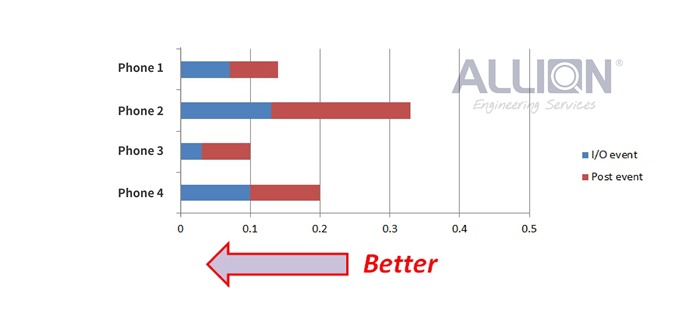
At the same time we will be measuring response speed; which, we will use as a benchmark for evaluating response time. Although the majority of providers are able to meet the highest standards, but there are still minuet differences which will determine the outcome. We were able to confiscate (obtain) a high speed camera from our lab engineers; who unwillingly parted (temporarily) with one of their fun toys. All this was done in the name of science and the pursuit of perfection for our results. (Note: no Allion engineers or equipment were harmed during the obtainment or process.)
- Vertical Interaction Touch Tests
Whether you’re a one dual hand fast runner or a one hand slasher, we all have our own unique way of browsing our favorite sites. Yet sometimes we are plagued with inconsistency and uneven slide motion. For the Vertical touch test, emphasis will be placed on whether the motions of the lines are smooth. In fact the contact gap is relatively small, so precision requirements from the camera is vital. From the data gathered it is possible to observe that P3 only requires 0.1 seconds to react.
In the test we found all phones had minor flaws, but P3 seem to have the best performance.
- Interference Rich Environments:
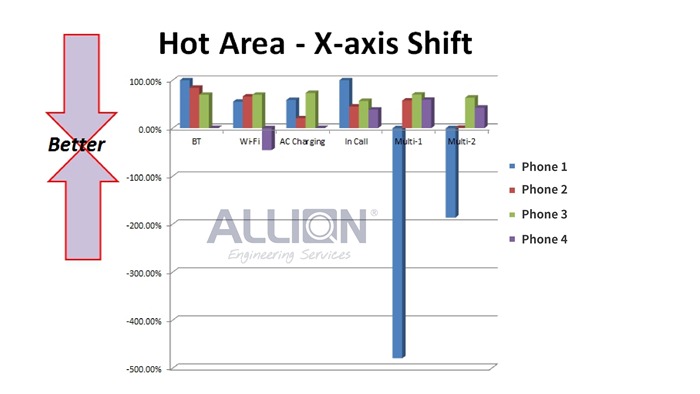
he user environment of today is bombarded by all sorts of signals such as Wi-Fi, Bluetooth® or AC chargers. These signals effect and interfere with the quality of products. Allion provides tests solutions for all these scenarios. Here we shall simulate a Wi-Fi and Bluetooth® transmission environment (Multi-1) to simulate surfing and listening to music via Bluetooth® earphones simultaneously. P1 was severely influenced in this environment; leading to a screen dead lock and missed calls.
After rigorous testing under 7 different categories, we found P3 performed best in display and brightness, P2 in Color Gamut and Bluelight P1. The camera functions were won by P2, P3 in terms of sharpness, Color Error P1. Finally Touch was won by P3; P4 performed well only in resistance against interference. In all P3 had an all-round performance in most categories.
To remain competitive, Mobile Device manufacturers must deliver superior technology at economical prices. With over 20 years in the quality testing industry, Allion helps companies build better products by offering professional engineering services for every stage of product development. As shown below, these comprehensive services include validation testing, compliance testing, interoperability testing, user experience optimization, and competitive analysis.

