


According to research firm IHS Markit, the number of IoT devices will increase on average 12% each year from 27 billion in 2017 to 125 billion in 2030. As more devices go on the Net, the limited wireless channels have become more congested that brings plenty of connectivity issues to the real-world and further deteriorates user’s experiences.
Unlike one-to-one communication of traditional devices, communication of IoT devices has become one-to-many. The performance of IoT devices should involve in three factors: product capability, network connectivity and user environment/ behavior. Vendors thus need a new methodology to verify products before launching to the market. This article will discuss a new methodology of IoT device validation “Heat Map Analysis”, which is used to perceive real-world factors and further discover and resolve common wireless connectivity issues.
The common connectivity issues users often encounter are:
1. Connectivity Instability
Distances of device-to-device (or device-to-AP) and decoration material are the most common factors in affecting the signal quality. For example, a user may find a mobile stay at full bars of signal in the living room, while barely getting one bar of signal in the bedroom. Wireless signals are often deteriorated by door, wall or other structures in buildings.
2. Communication Latency
Another common connectivity issue is communication latency. Users often find network latencies or sudden stops even a device is at full signal bars. Communication latency occurs when co-channel interferences or signals (e.g. Wi-Fi, Zigbee, Thread, etc.) coexist under the same roof.
3. Poor Roaming Capability
Since the network coverage of a wireless access point (AP) has its limitation, the connected device needs to roam around different APs to continue its connectivity. However, latencies or sudden stops are often occurred when a device is switching among various APs constantly. For example, we found a robot cleaner was not able to transmit/receive command when proceeding its work from the kitchen to the dining room (i.e. roaming from AP A to AP B). The cleaner thus needs to re-connect to the network, and this process usually deteriorates user’s experiences.
Those issues mentioned above will be just the tip of the iceberg. Since most smart devices (e.g. cameras, outlet, lighting and smoke detector etc.) are connected to wireless network in the future of the smart home, new connectivity issues will keep popping up one after another. Connectivity issues can be minor problems decrease user satisifcation, but also be serious ones that cause any accident (e.g. accidental death/injury or property loss etc.). It turns out to destroy your brand reputation and business.
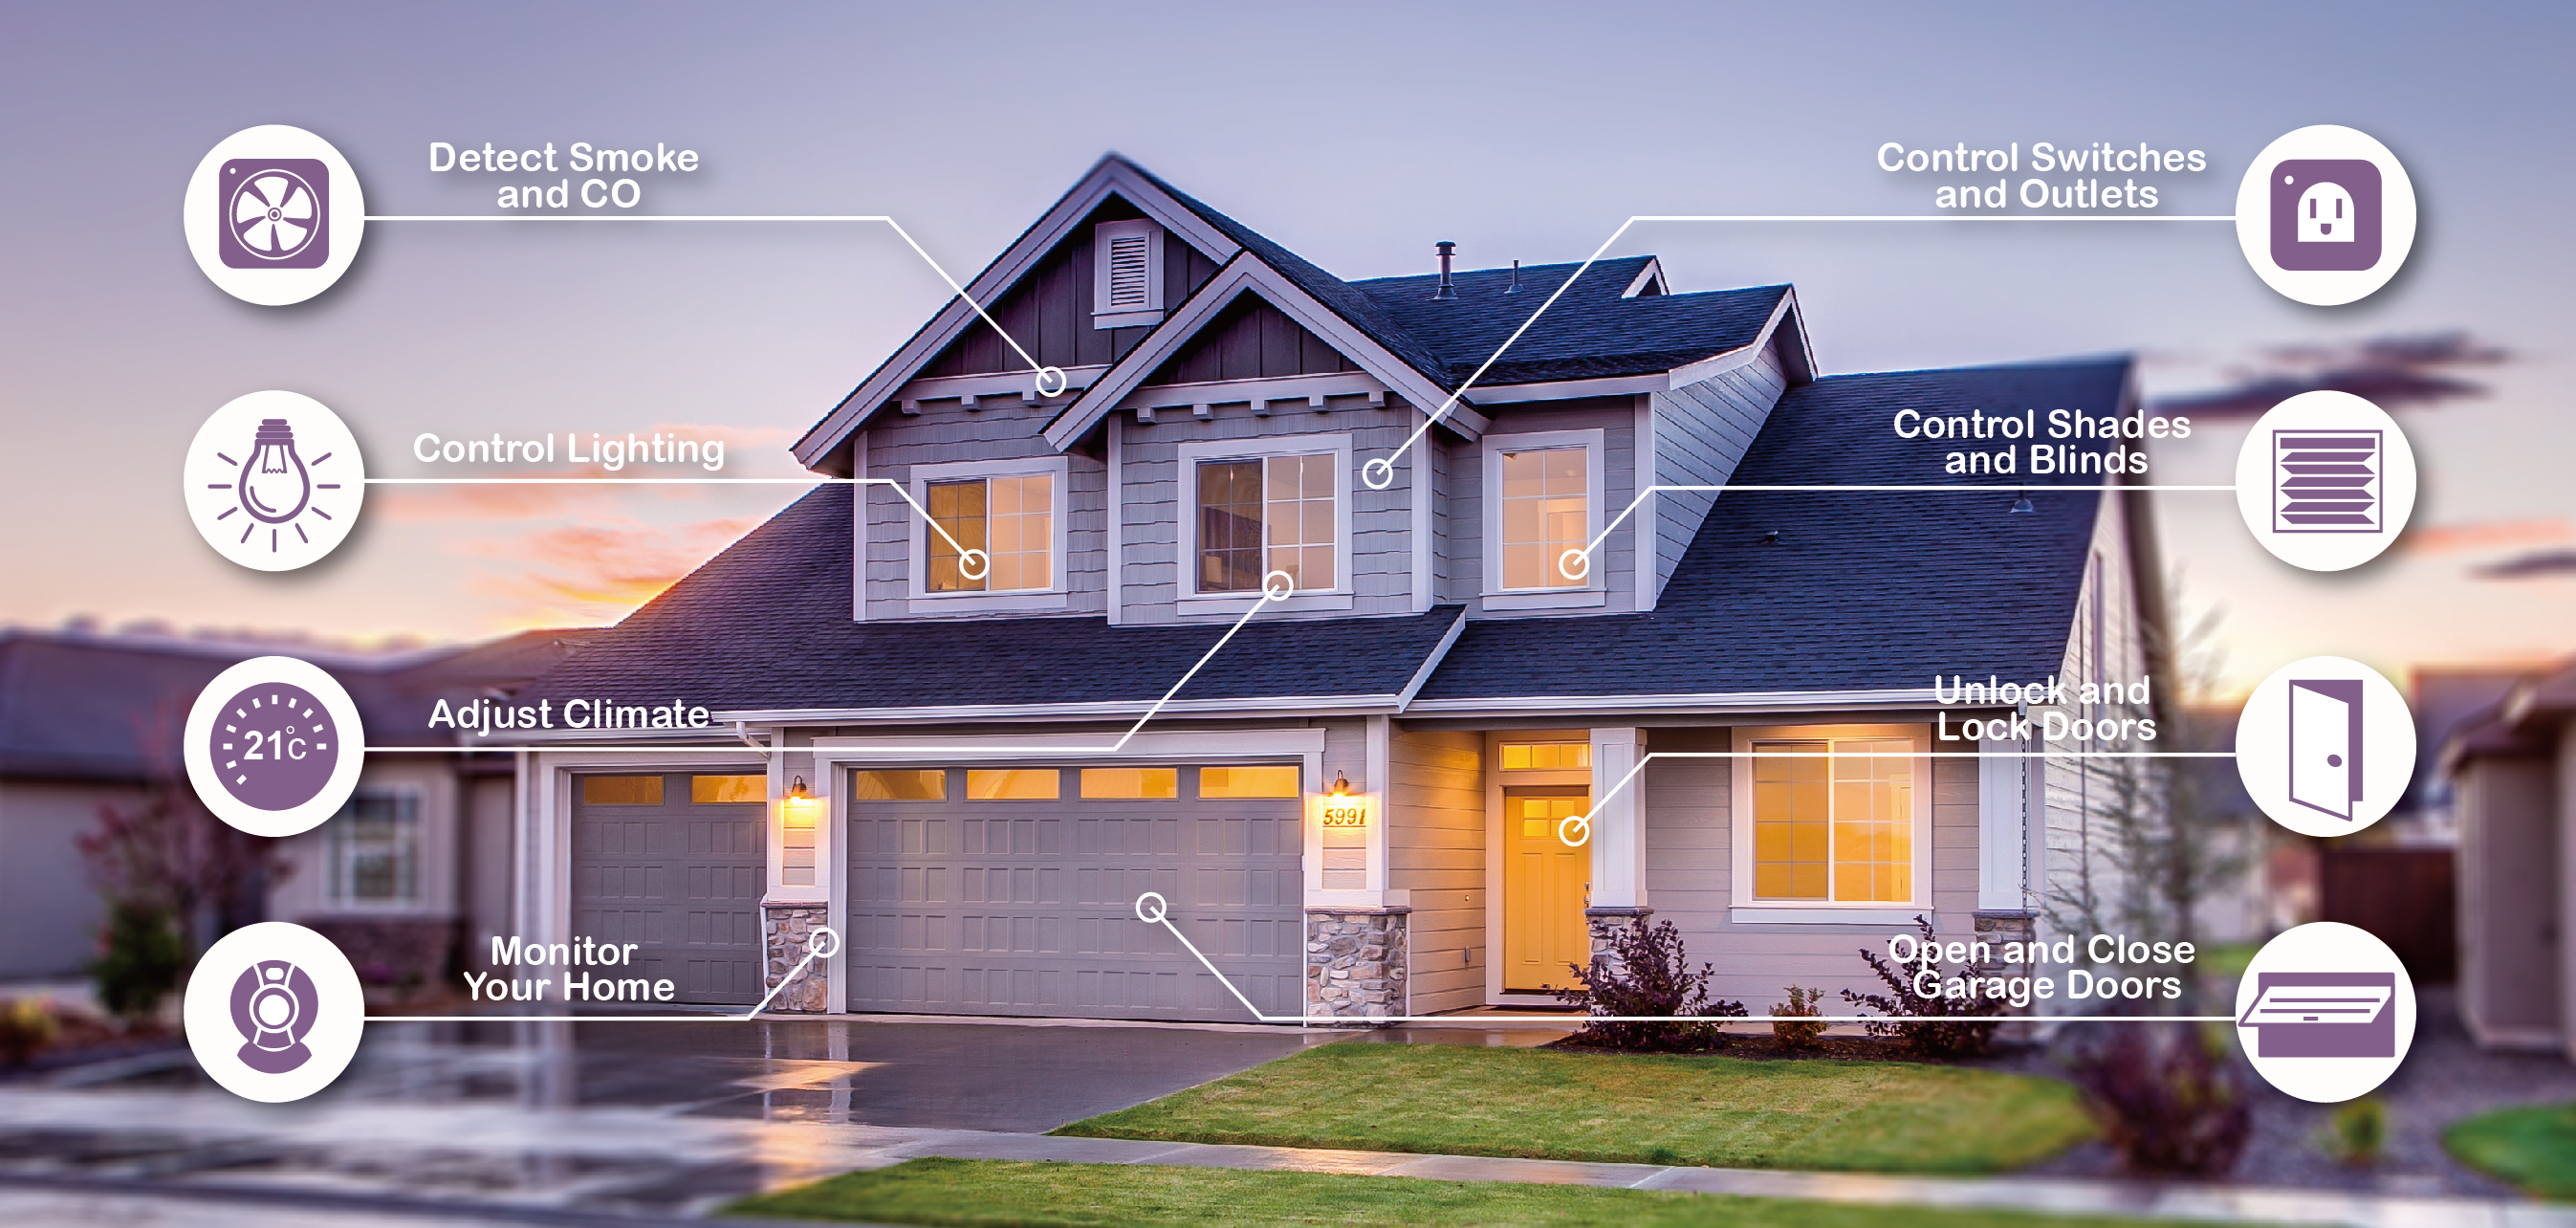
Illustration: Stable network connectivity is the key for multiple smart home applications
Allion has over 10-year experience in wireless testing and validation, and also the authorized testing labs, accredited by Wi-Fi, Bluetooth®, Lora and OCF. Now Allion launches Heat Map Analysis, a brand-new wireless signal validation program that allows you to consider real-world factors during the product validation process, and further discover and resolve wireless connectivity issues.
Why Heat Map Analysis is Crucial?
IoT technology has sophisticated the applications of wireless technology, constructing a more complex wireless ecosystem. Heat Map Analysis includes multiple situation models that structured by various user behaviors, bring the realities to the lab. The two advantages of Heat Map Analysis are:
1. Visualize the Invisible Radio Frequency
Heat Map Analysis is able to visualize invisible Radio Frequency (RF), allowed to verify the relationship of different wireless signals. Rather than traditional log-linear analysis, the Heat Map Analysis is developed to obtain an immediate visual summary for various wireless signals, perceiving Received Signal Strength Indicator (RSSI) to validate the connectivity (e.g. Wi-Fi, Bluetooth®, ZigBee etc.) and performance of smart devices.
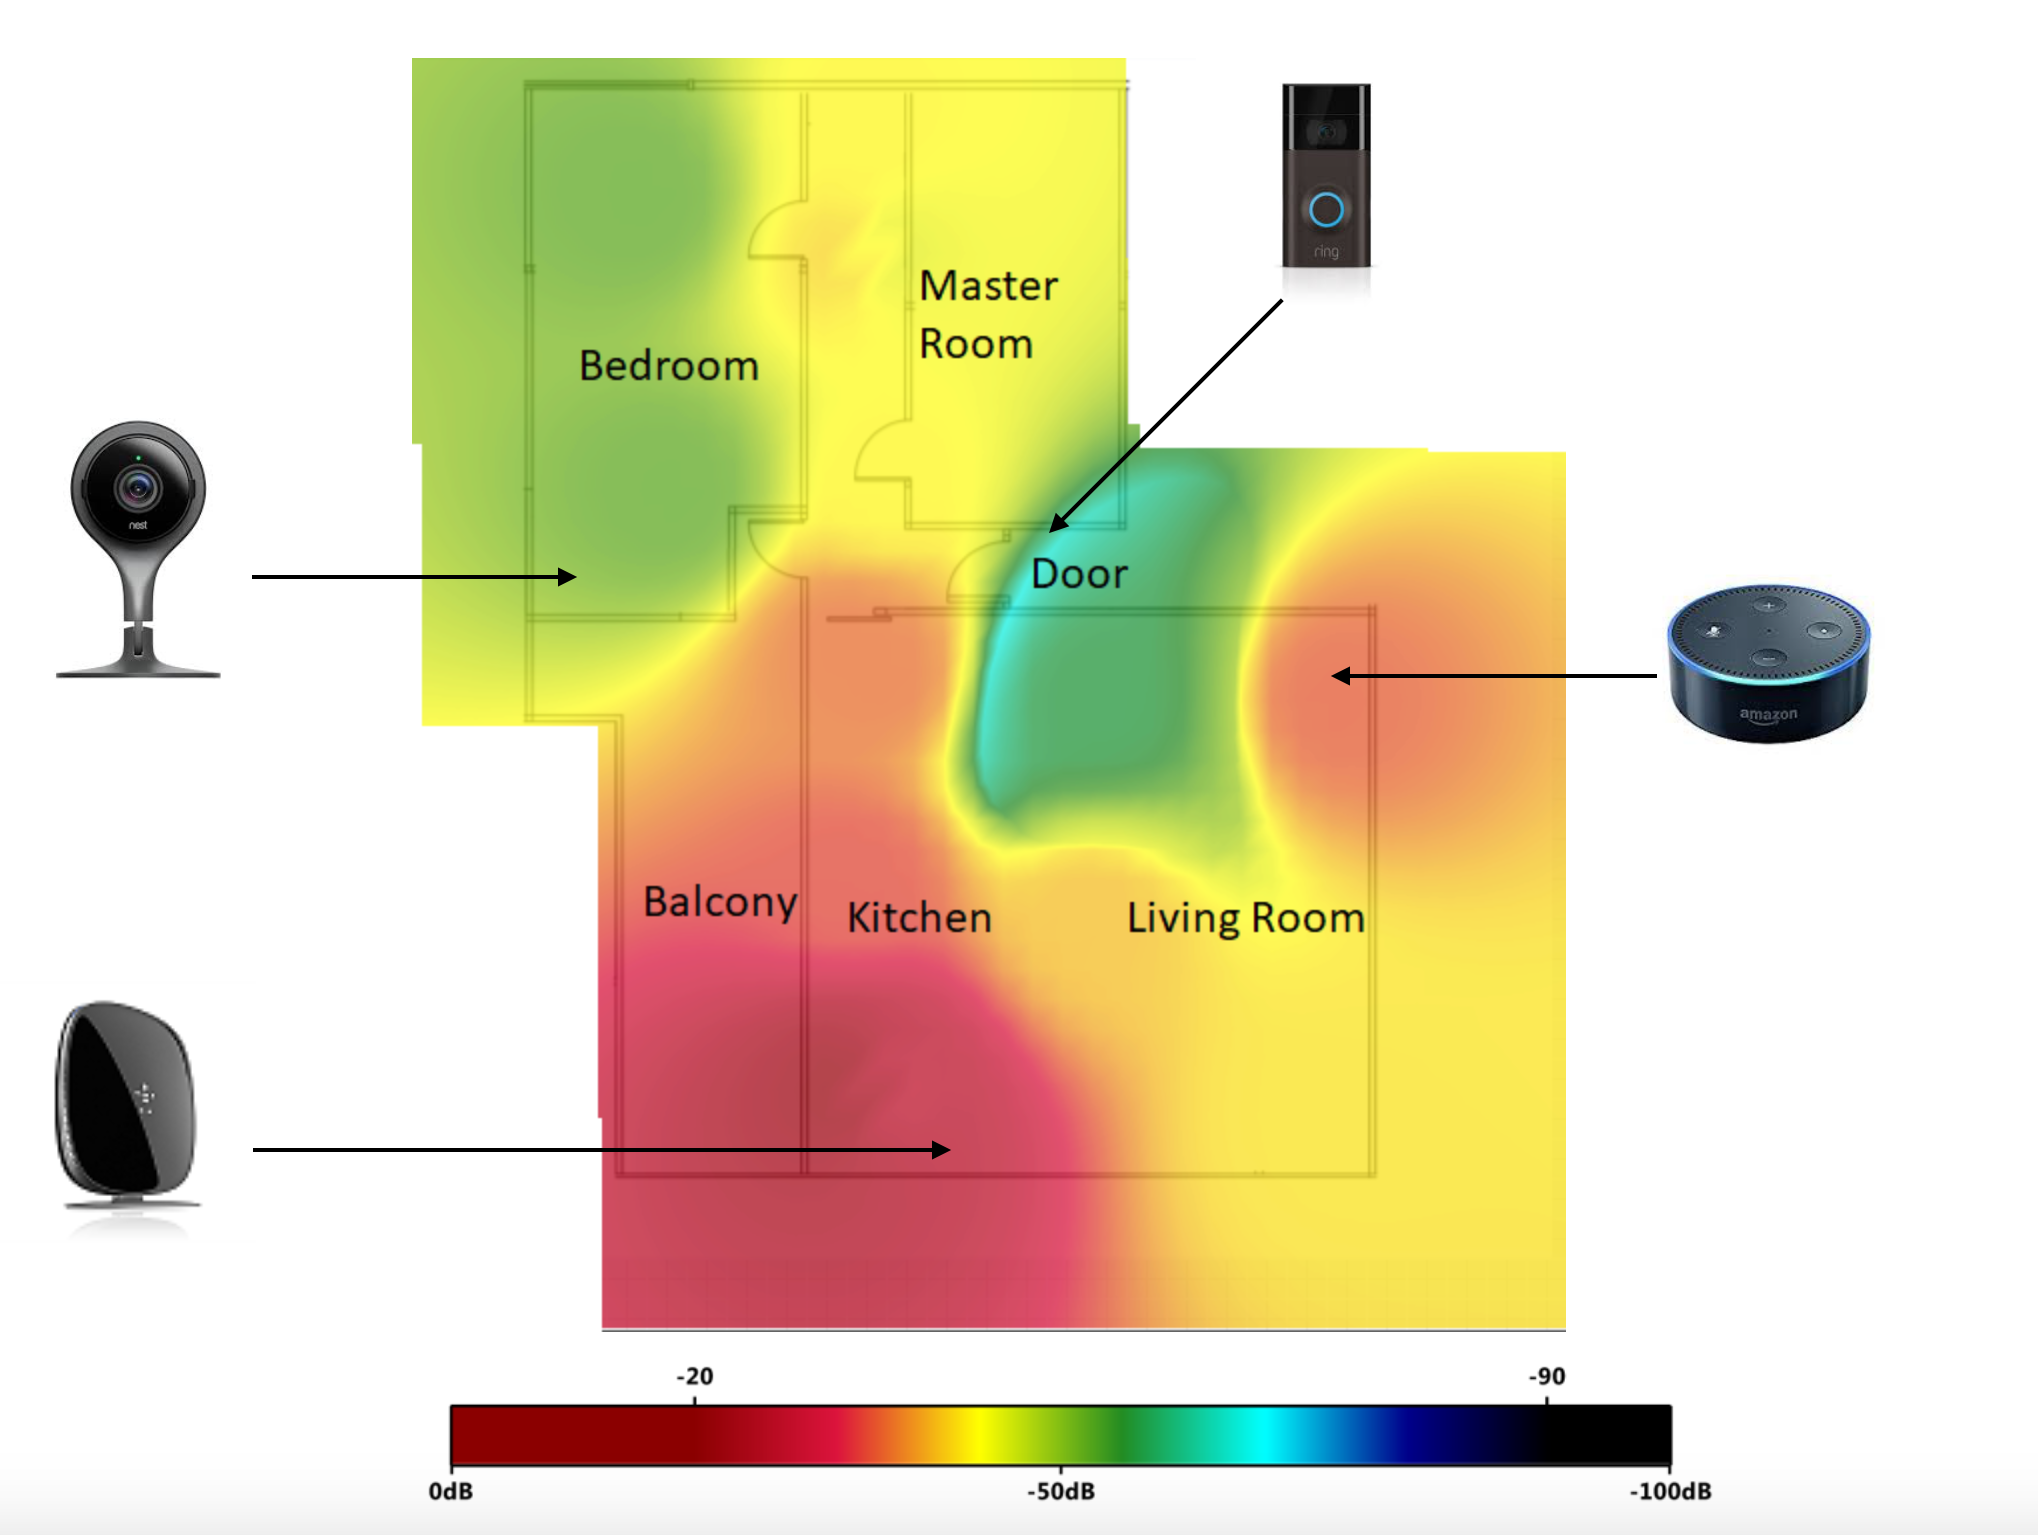
As the figure shown above, it is the strong Received Signal Strength Indicator (RSSI) rate in the red area where a device can get strong Wi-Fi signal. The yellow area is detected as a reliable signals level. The green area is detected as an acceptable signals level while the blue area is detected as an unreliable signals level (in terms of weak RSSI.) After testing signals of smart devices in various areas (i.e. red, yellow, green and blue area etc.) with different signal levels, the devices did have different performance in accordance with the heat map results. The heat map analysis can help you to validate the connectivity in any scenario, such as at home, or in the office.
There are also three reference indicators used to measure connectivity:
1. Latency
2. Throughput
3. Packet Loss
By utilizing heat map analysis and the three reference indicators, we can cross compare results and outcome values to analyze connectivity and find out root causes to trigger connectivity issues.
2. Identify Root Causes through Real-world Scenario Simulation
There are dozens of variables (e.g. AP positioning, circumstance, network infrastructure, and even the furniture material, etc.) that could affect the wireless signals and even degrade the performance of IoT devices. Allion is able to identify root causes accurately through real-world scenario simulation considering with all the environmental factors.
As the figure shown below, the left side is clear signal ecosystem while the right side is complex signal ecosystem with multiple signals interference. When these signals (e.g. Wi-Fi, Zigbee, and Thread are using 2.4G spectrum simultaneously) coexist, co-channel and adjacent-channel interferences would be occurred and further degrade the performance of IoT devices. By identifying signal strength and signal distribution of heat map analysis, we could provide a solution for you to find a perfect match at home.
However, there is an entry barrier (could be cost or technology) of constructing a testing environment with all the variables. Allion has built IoT innovation center which includes dozens situation models, along with Heat Map, aiming to help our clients discover and resolve issues before releasing products to the market.
A Power User’s Perspective: Multiple Connectivity Issues Found in Reality
To better verify the wireless performance in reality, we invited a power user to join our real-world scenario testing plan to do the real tests at his apartment. The apartment is composed of diverse smart devices, such as camera, voice assistant, smart lock, smoke detector etc. The space is 1957.45 Sqft, with 2 AP distributions. Surprisingly, the heat map analysis result shows that certain devices have poor wireless performance. Furthermore, one-third of the area is covered with bad signals or no signals even with 2 AP distributions (See the illustration below: it is the weak Received Signal Strength Indicator rate inthe blue area.) We will share three examples below to describe the issues occurring in different scenarios.
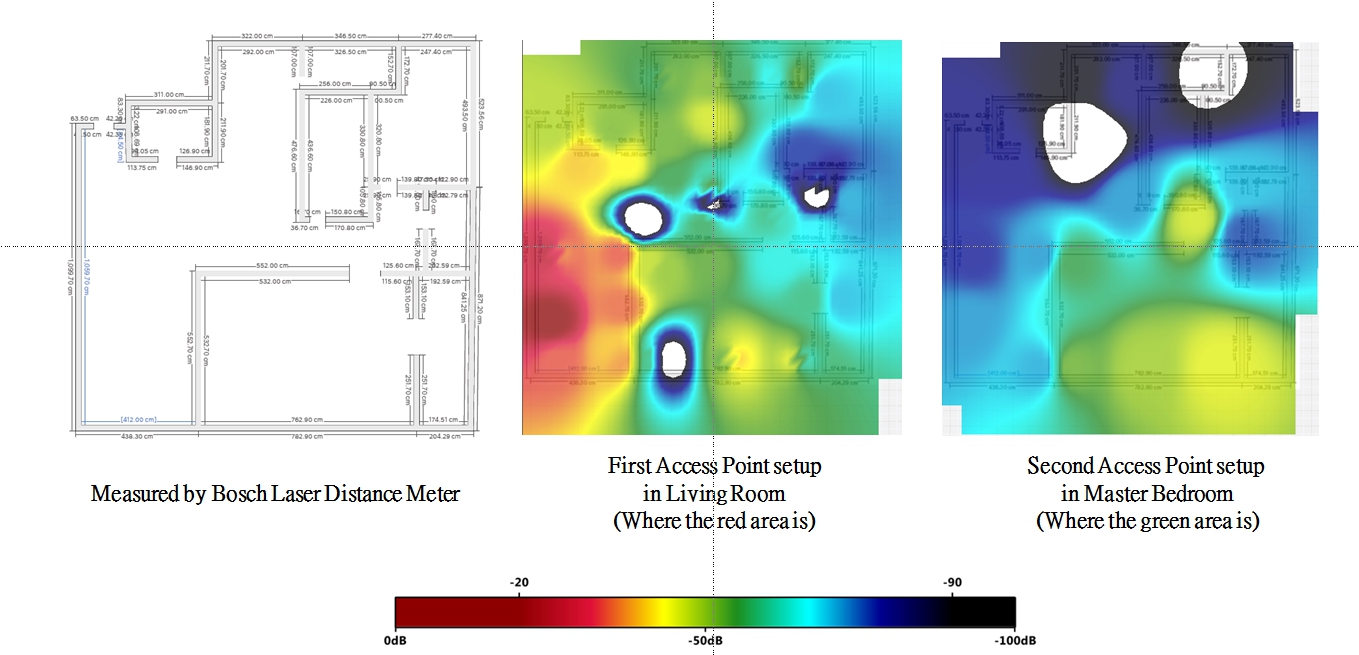
Illustration: one-third of the area is covered with bad signals or no signals even allocating with 2 APs
Situation One: Sudden Stops of the Camera
Just like the typical smart home needs a surveillance system/device, this power user set up a smart camera at the front door to detect what’s happening at home. Set-up is super easy. He didn’t have any headaches with getting the smart camera work and could watch live video feed on a web browser smoothly. But after 10 or so minutes, sudden stops of the camera occurred. He checked the three referenced indicators of the network; however, latency performance and throughput performance are both excellent, and package loss is acceptable. You may doubt distance is the reason to cause this issue? No, there’s only 5-meter distance between the camera and the nearest AP! The connectivity of the smartcam is so unstable, even though it was in Line-of-Sight distance.
The smartcam was back on the right track after this power user shifted the smartcam a little bit. Interoperability (device-to-device; device-to-AP) or any material used in upholstery (e.g. metal, concrete, etc.) could be one of the factors to trigger connectivity issues. In this case, the root cause is metal material which is used for Chinese upholstery “Feng Shu” (Feng Shu an ancient Chinese belief that the way you built your home affecting success, health, and happiness.) Materials like concrete and metal tend to be the worst for blocking Wi-Fi Waves. Since different cultures have different principles/preferences of home decoration, there must be multiple ways to use material in upholsteries around the world. This case is not just a single case users would encounter.
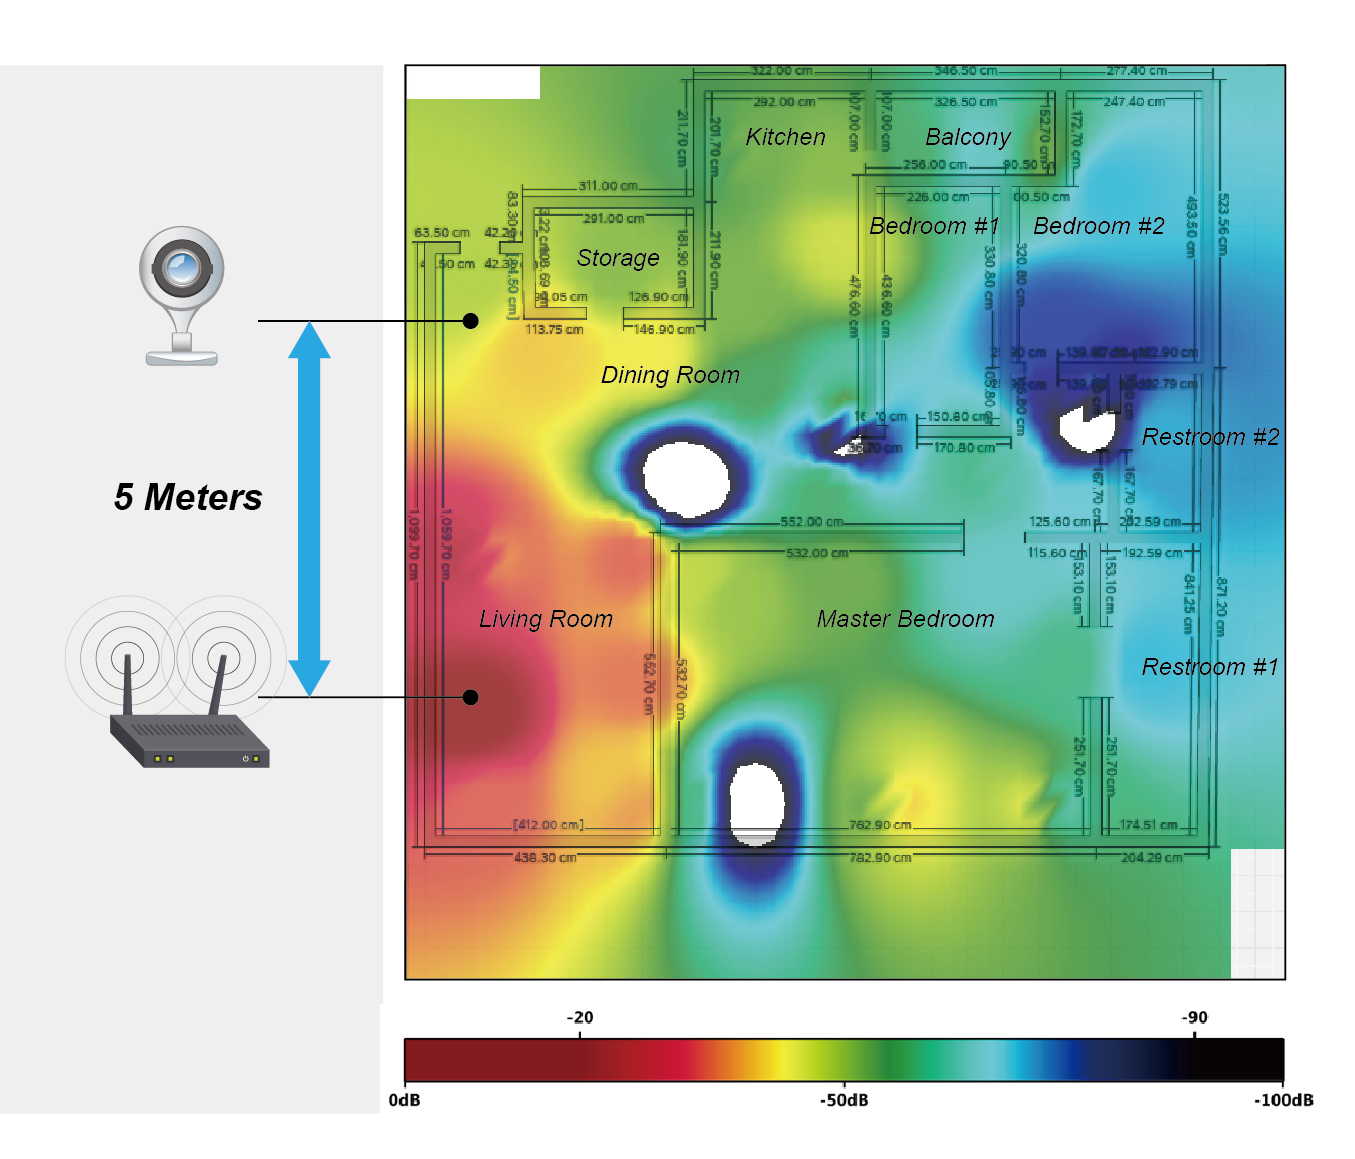
Illustration: the smart camera was sudden stopped even there is only 5-meter distance between the camera and AP.
Situation Two: Latencies Were Occurred When Devices Placing at Different Furniture
The power user is used to placing different smart devices, (e.g. smart assistance and smart plug) at table. Even in the same user scenario, the same devices would have different performance when they were placed on two different tables using different textures. For example, the smart speaker might play with a delay of couple of milliseconds at a mental table. It worked just fine as a way to play music from his smartphone when placing at a woody table.
Through the heat map analysis of this situation, we found the root cause is furniture textures. The device would have better signal performance when placing at a woody table than placing at mental table. Materials like metal tend to easier affect signals and cause latency. Apart from that, short-distance interference can be another factor. For example, interference between AP and set-top-box occurs when placing together at one specific spot.
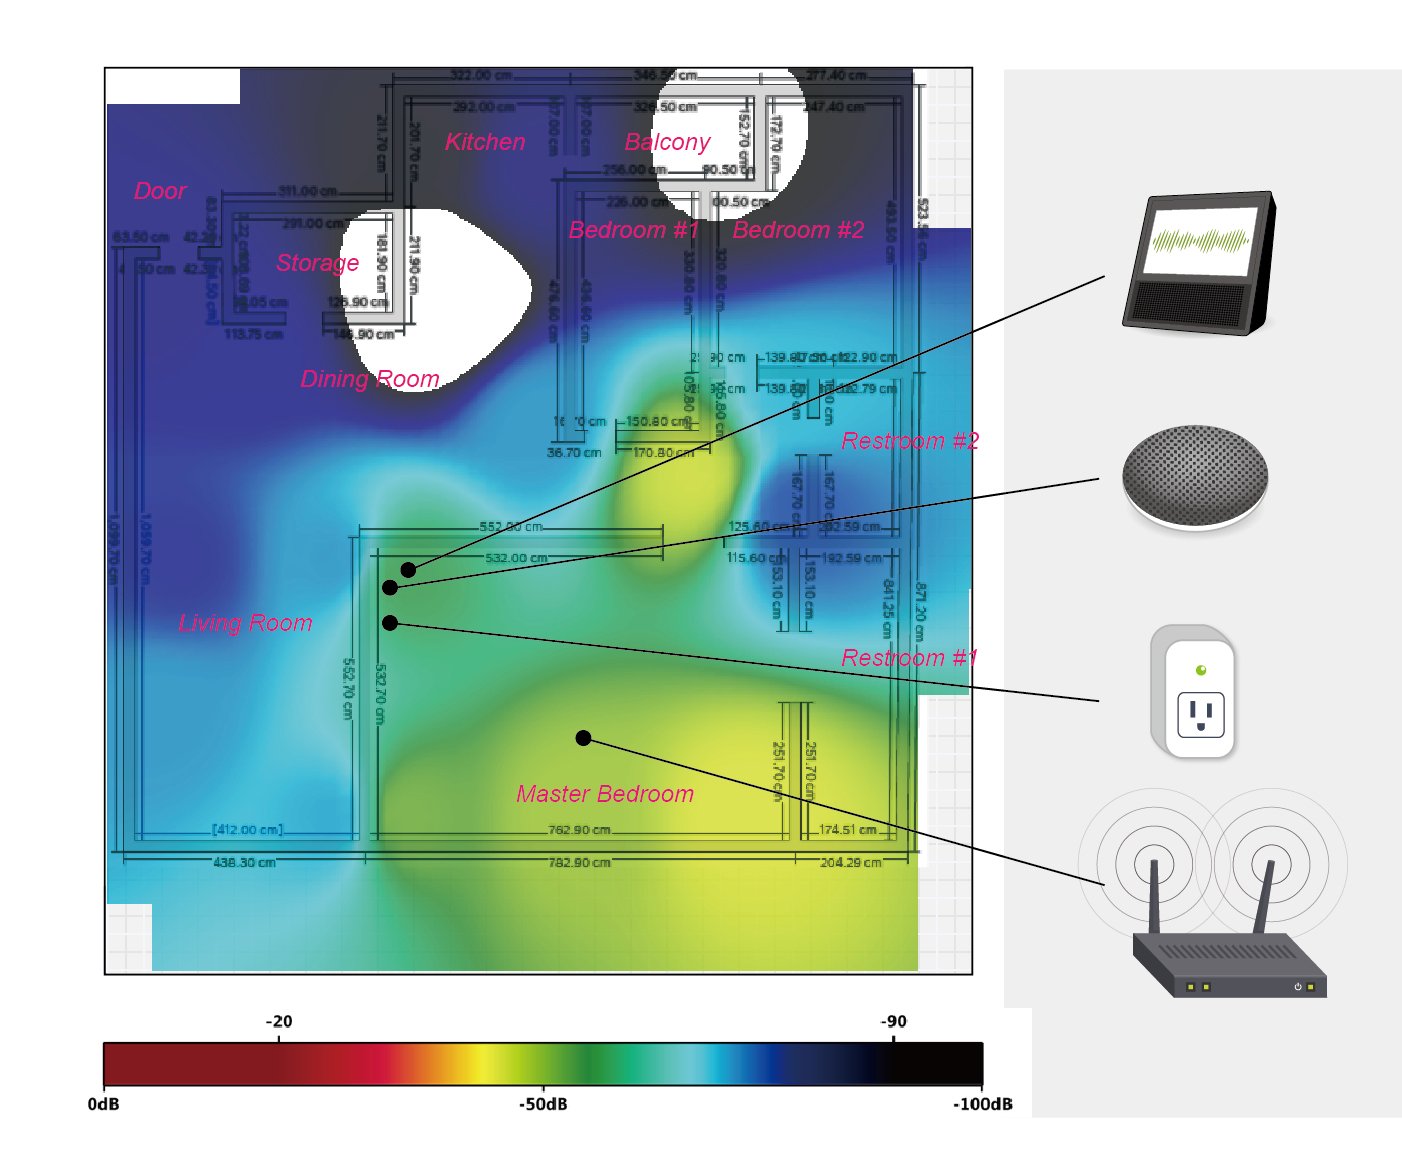
Illustration: communication latencies were occurred when placing same devices at different furniture textures
Situation Three: No Signal Occurs at Particular Spots
The power user claimed that the signal in the dining room was unstable. However, there are no problems with the device function and the network connectivity. He could neither receive any signal when sitting on the chairs in the dining room. He could receive signal until walking through the dining room.
It is difficult to find out the root causes of unstable signal without Heat Map. Generally, furniture, pillar, mirror, specific article, or any interference by metal would reduce the wireless signal coverage. In this case, Heat Map result shows a signal black hole in the dining room (see the below illustration). We refer to the heat map graph and find the positioning of the black hole in the real world. It is referred that the interference came from a massage armchair.
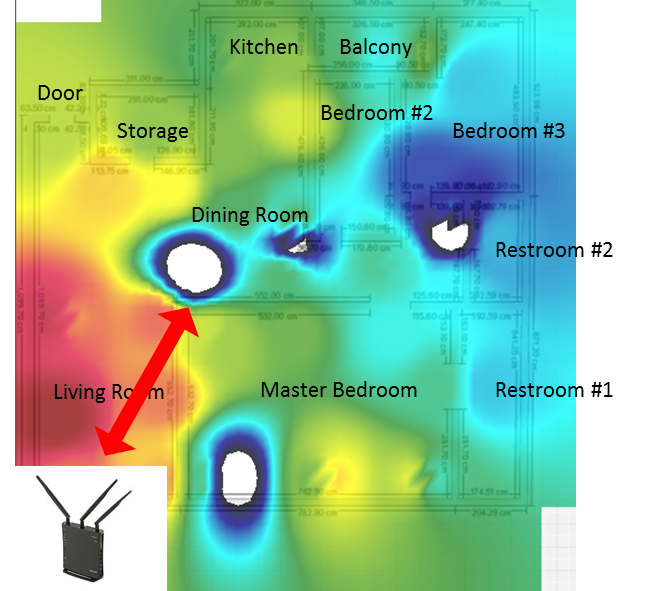
Illustration: furniture textures or material can affect the connectivity of connected devices.
To sum up, stable network connectivity is the necessity for future life as same as stable power supply nowadays. When most smart devices are connected to wireless network in the future of the smart home, the wireless connectivity issues will become major issues. Vendors should take connectivity issues seriously and further to resolve them before products launch to the market.
RF Validation Service Improves Your Wireless Performance
In the IoT product life cycle, how to improve the product performance is as important as how to discover issues. RF validation service allows you find root causes after discovering issues by the heat map analysis. A completed RF validation includes the efficiency analysis of antenna, the transmit accuracy/receive sensitivity evaluation of module, and the TRP/TIS results of product.
.jpg)
Noise interference might affect wireless performance. Generally, noises were occurred by PCB layout, Connectors, CPU and GPU, etc. To find the possible root-cause of noises, we can observe the noise distribution in frequency domain.
Different user scenarios might degrade wireless performance. For example, “Wi-Fi De-Sense” is often caused by plugging USB 3.0 dongle into PC. Therefore, we design (or duplicate) various test scenarios to help our clients find root-causes of their De-Sense Issues.
Coexistence issues could be caused by using the wireless technologies that have similar frequency bands simultaneously. 2.4G spectrum is occupied by those wireless technologies (e.g. Wi-Fi, Zigbee, Bluetooth®). Thus users might find latencies or sudden stops when Wi-Fi and Bluetooth® are both activated on device.
Build Perfect User Experiences by Integrating IoT Validation Services
Internet of Things (IoT) has sophisticated the product validation process. Traditional functionality/performance testing is fundamental; it cannot cover every aspect of applications of wireless technology though. Allion has equipped comprehensive RF test apparatus, including 843 Chamber, 333 Shielding Room, and Shielding Box etc. for offering RF signal testing, measurement and analysis. With several year experiences in IoT testing methodologies research and development, Allion built IoT Innovation center, structured five types of user scenarios, including apartment, suite, house, smart buildings, command and control center allowing clients to validate the functionality, performance, and interoperability of their products.

Allion understand the industry trend, and has confidence to build perfect user experiences by integrating IoT product validation services. We are at the forefront of implementing testing methodology using upcoming IoT technologies to fulfill your product requirements. Stay tuned with us for more Allion’s IoT validation services!