


Allion Labs | Henry Chen
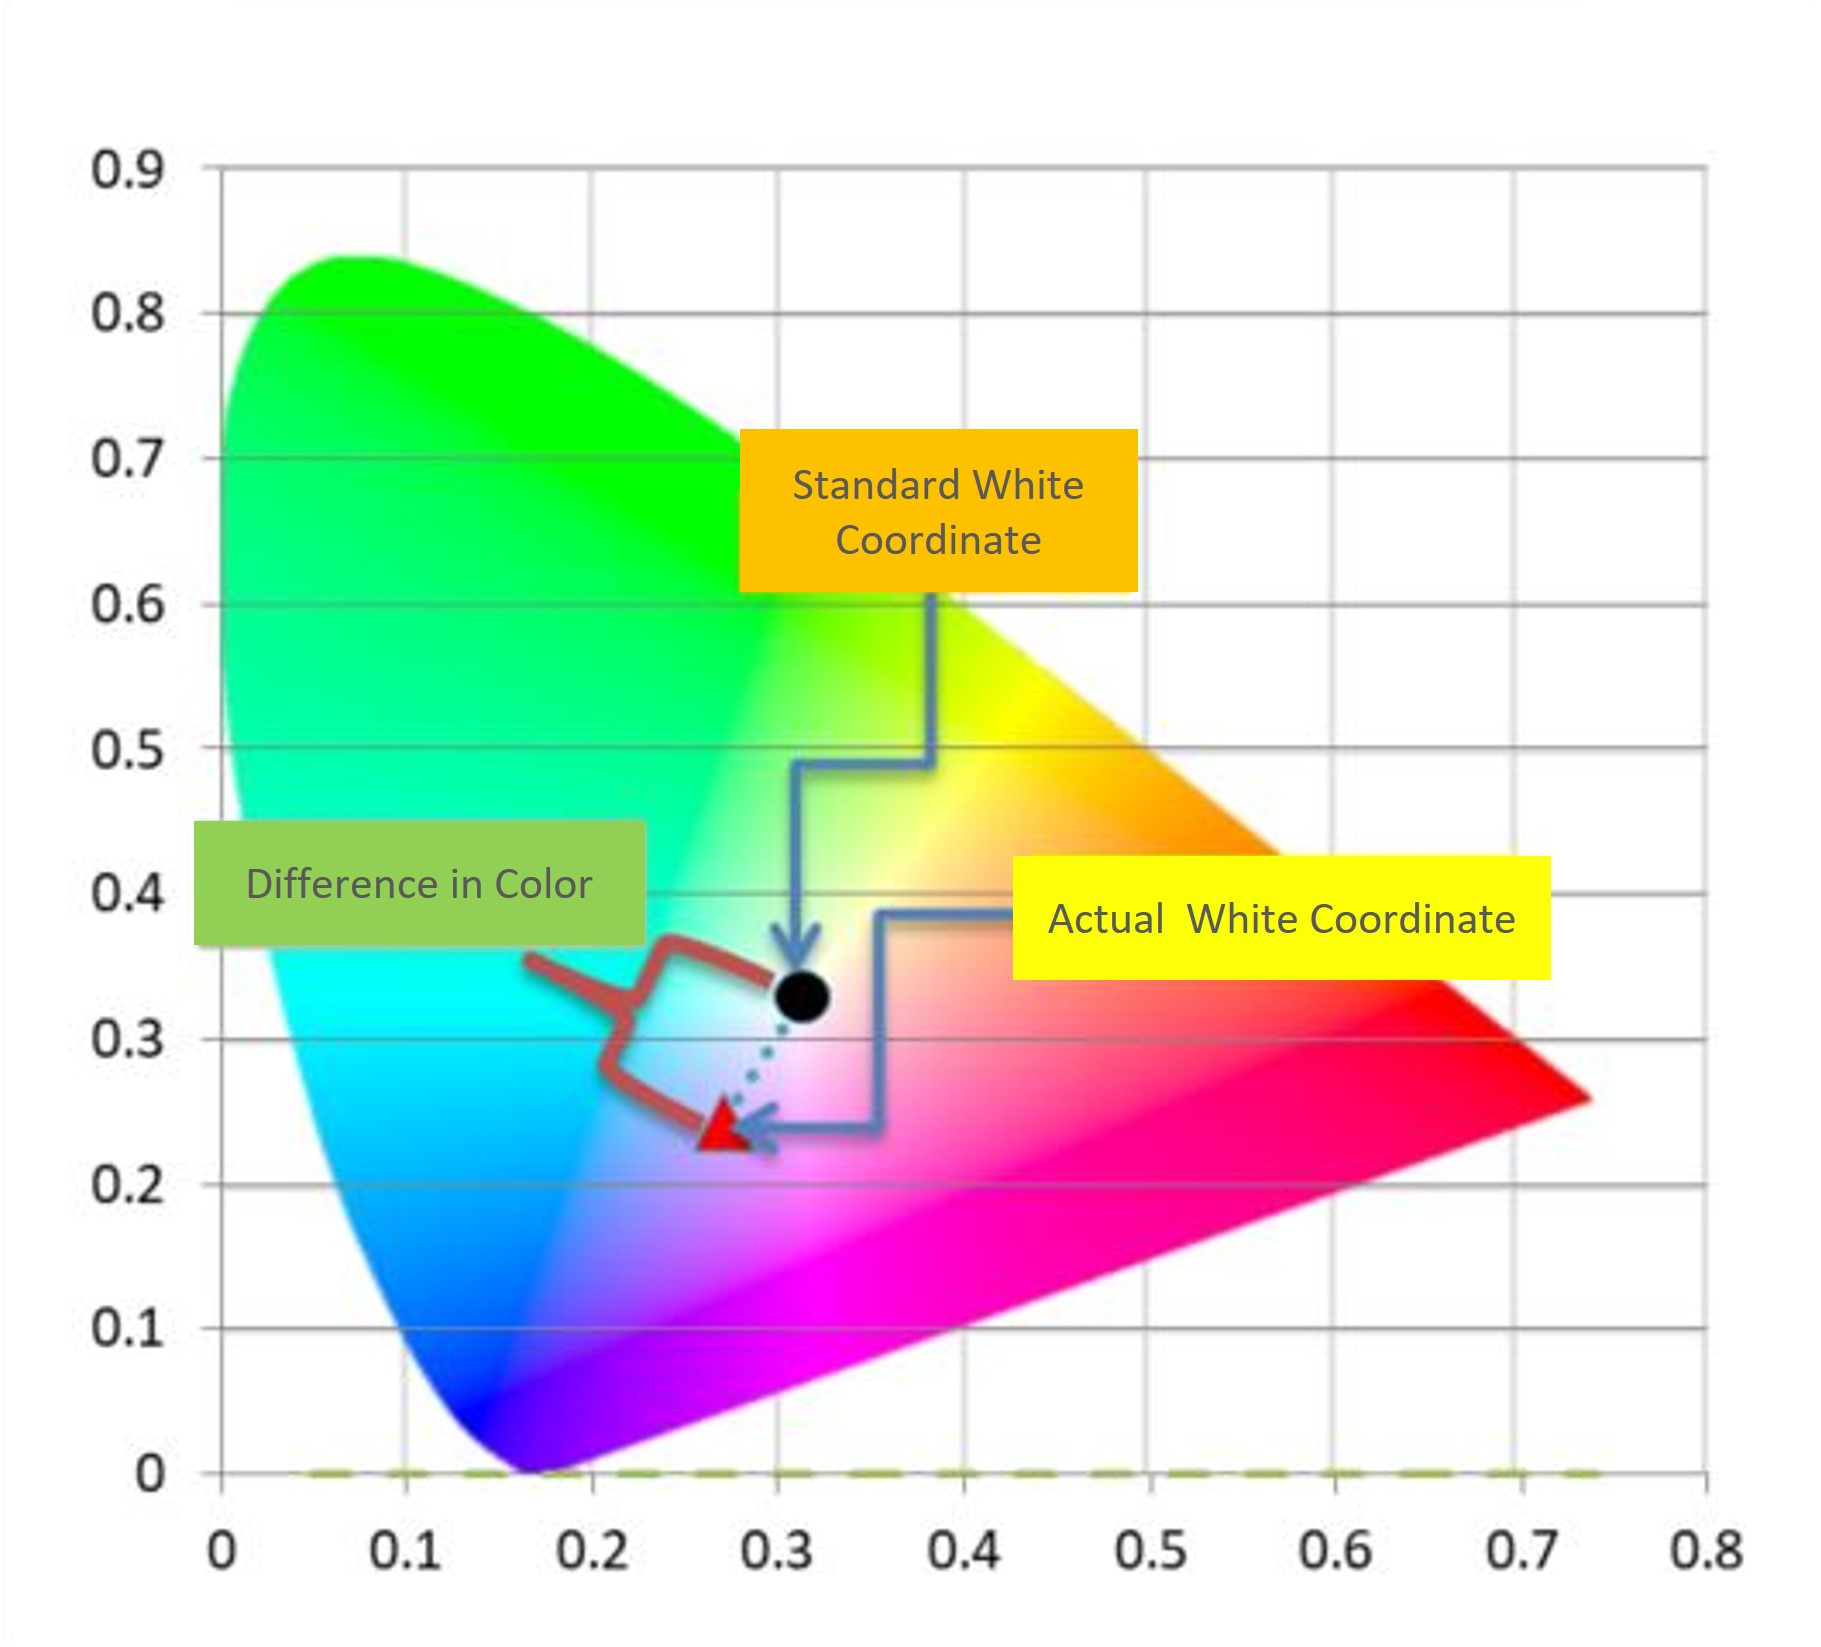
In the past, the difference between two colors could only be expressed through subjective descriptions. Color difference is a quantitative concept that expresses the degree of differences between colors by the distance between two-dimensional coordinates in color space.
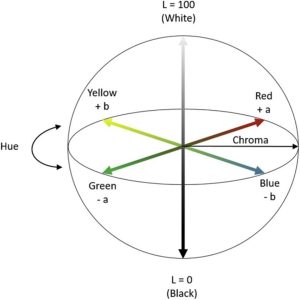
CIE L*a*b* is the most complete color model commonly used for describing all colors visible to human eyes. It was proposed by the CIE (International Commission on Illumination) for this specific purpose. The asterisk (*) after L, a, and b are a part of its full name; L* represents the change in brightness from bright (L*=100) to dark (L*=0), a* represents the change in color from green (-a*) to red (+a*), and b* represents the change in color from yellow (+b*) to blue (-b*).
What is Delta E?
Delta E, or ΔE, is a kind of measurement standard, also known as ΔE*ab (or “ΔE*”, “dE*” and “dE”), which is developed by the CIE to quantify the difference between two colors displayed on a screen. Delta E goes from 0~100; the closer to 0, the smaller the color difference, and the closer to 100, the more serious the distortion will be. The standard range of perception for average people is shown as follows:
ΔE <= 1: Human eyes cannot easily tell the difference
ΔE <= 2: Differences can be perceived with careful observation
ΔE <= 4: Shipping standards as defined by most manufacturers
ΔE <= 10: Perceptible difference through casual observation
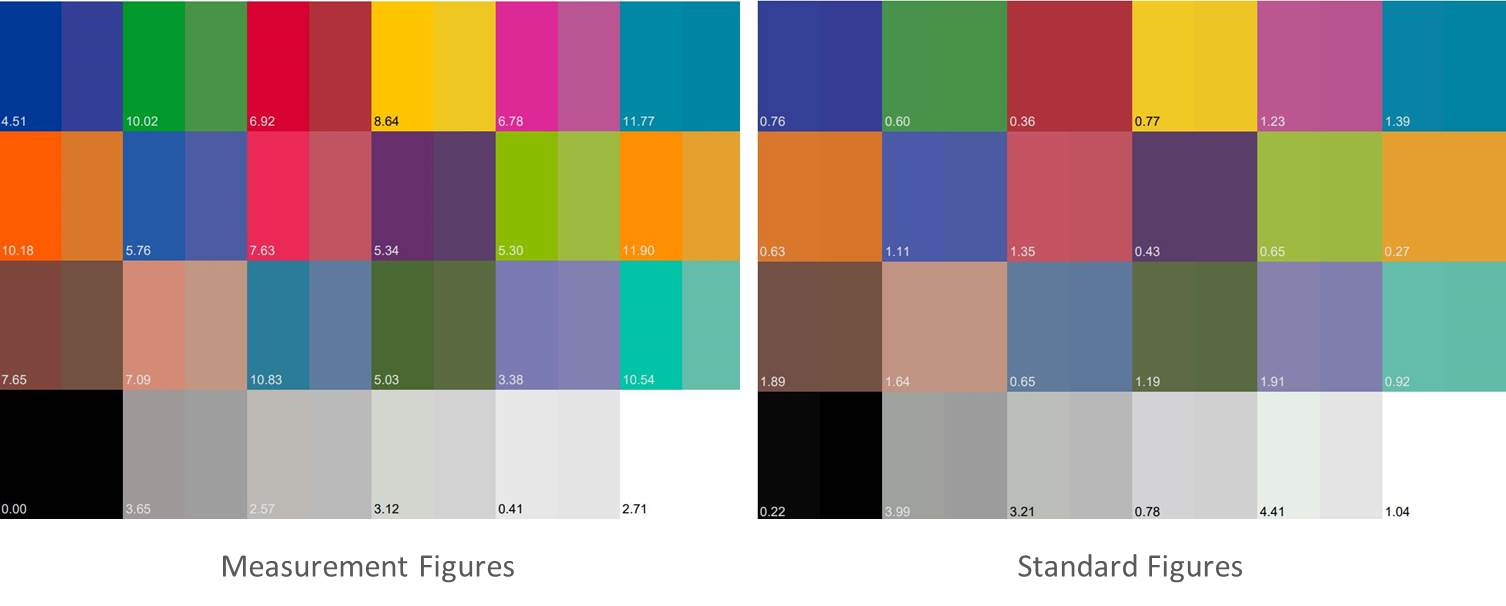
From the two pictures below, you can get a feeling of the differences in color distortion of different delta E values.
Allion possesses many years of experience in panel testing for products such as monitors and TVs. We have found that the color performance of panels varies depending on different conditions and settings. User experience has always been the focus of our services, so we conducted an experiment to measure delta E on a monitor and a computer respectively in different usage situations, to see the differences.
Allion Test Findings: Monitor
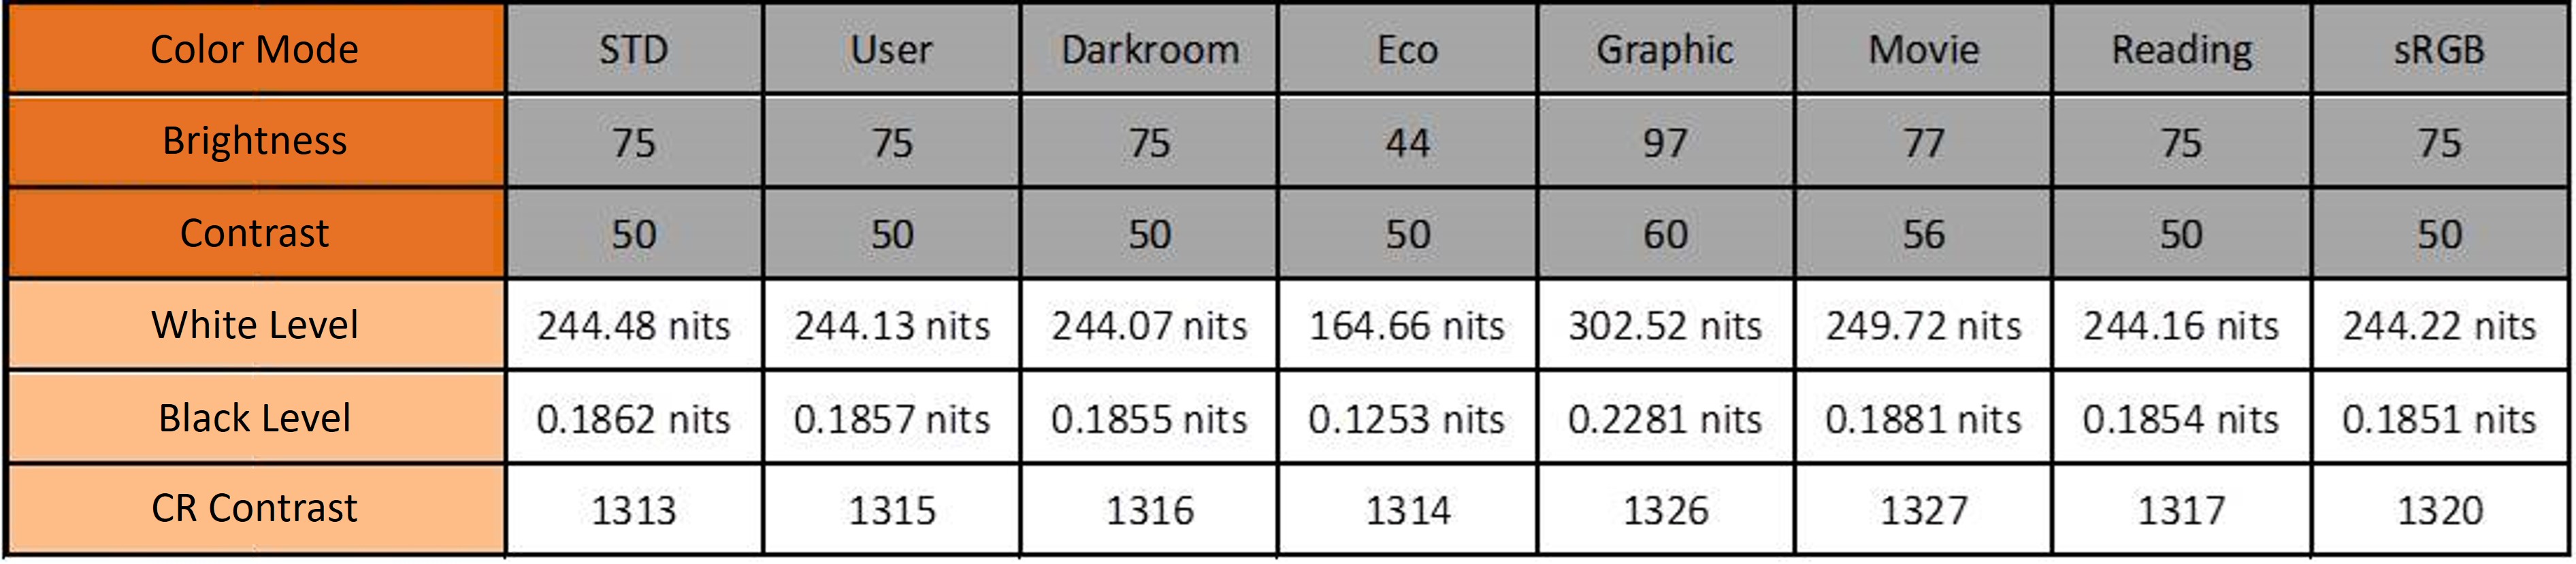
After we returned the screen settings to their default values, we measured the other 7 color mode settings that could be selected in the OSD, in addition to the default Standard. From the table below, we can see that the contrast performances of all 8 modes are very consistent, which may affect the performance of Grayscale.
As we can see from the chart below, the Delta E data for all 8 color modes are consistent and the color performance experience is very consistent no matter how the user switches between color modes.
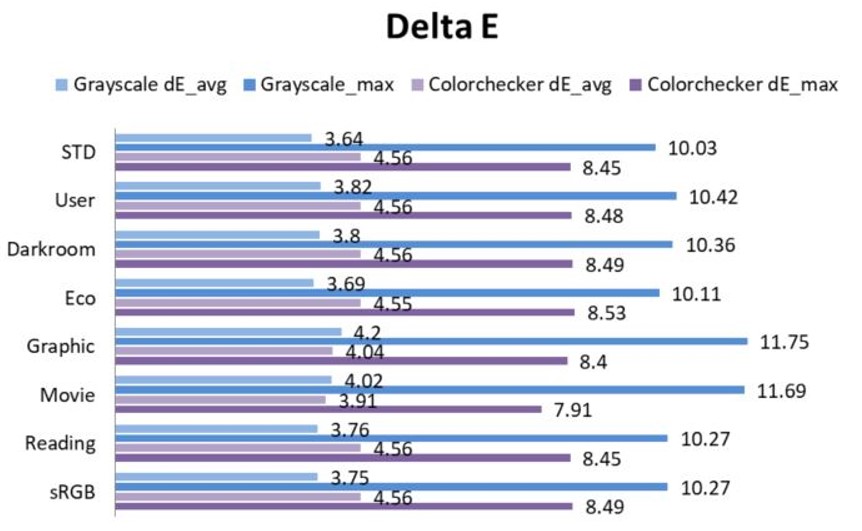
If we do a differentiation analysis between the Standard mode and others, we can find that the difference is really small.

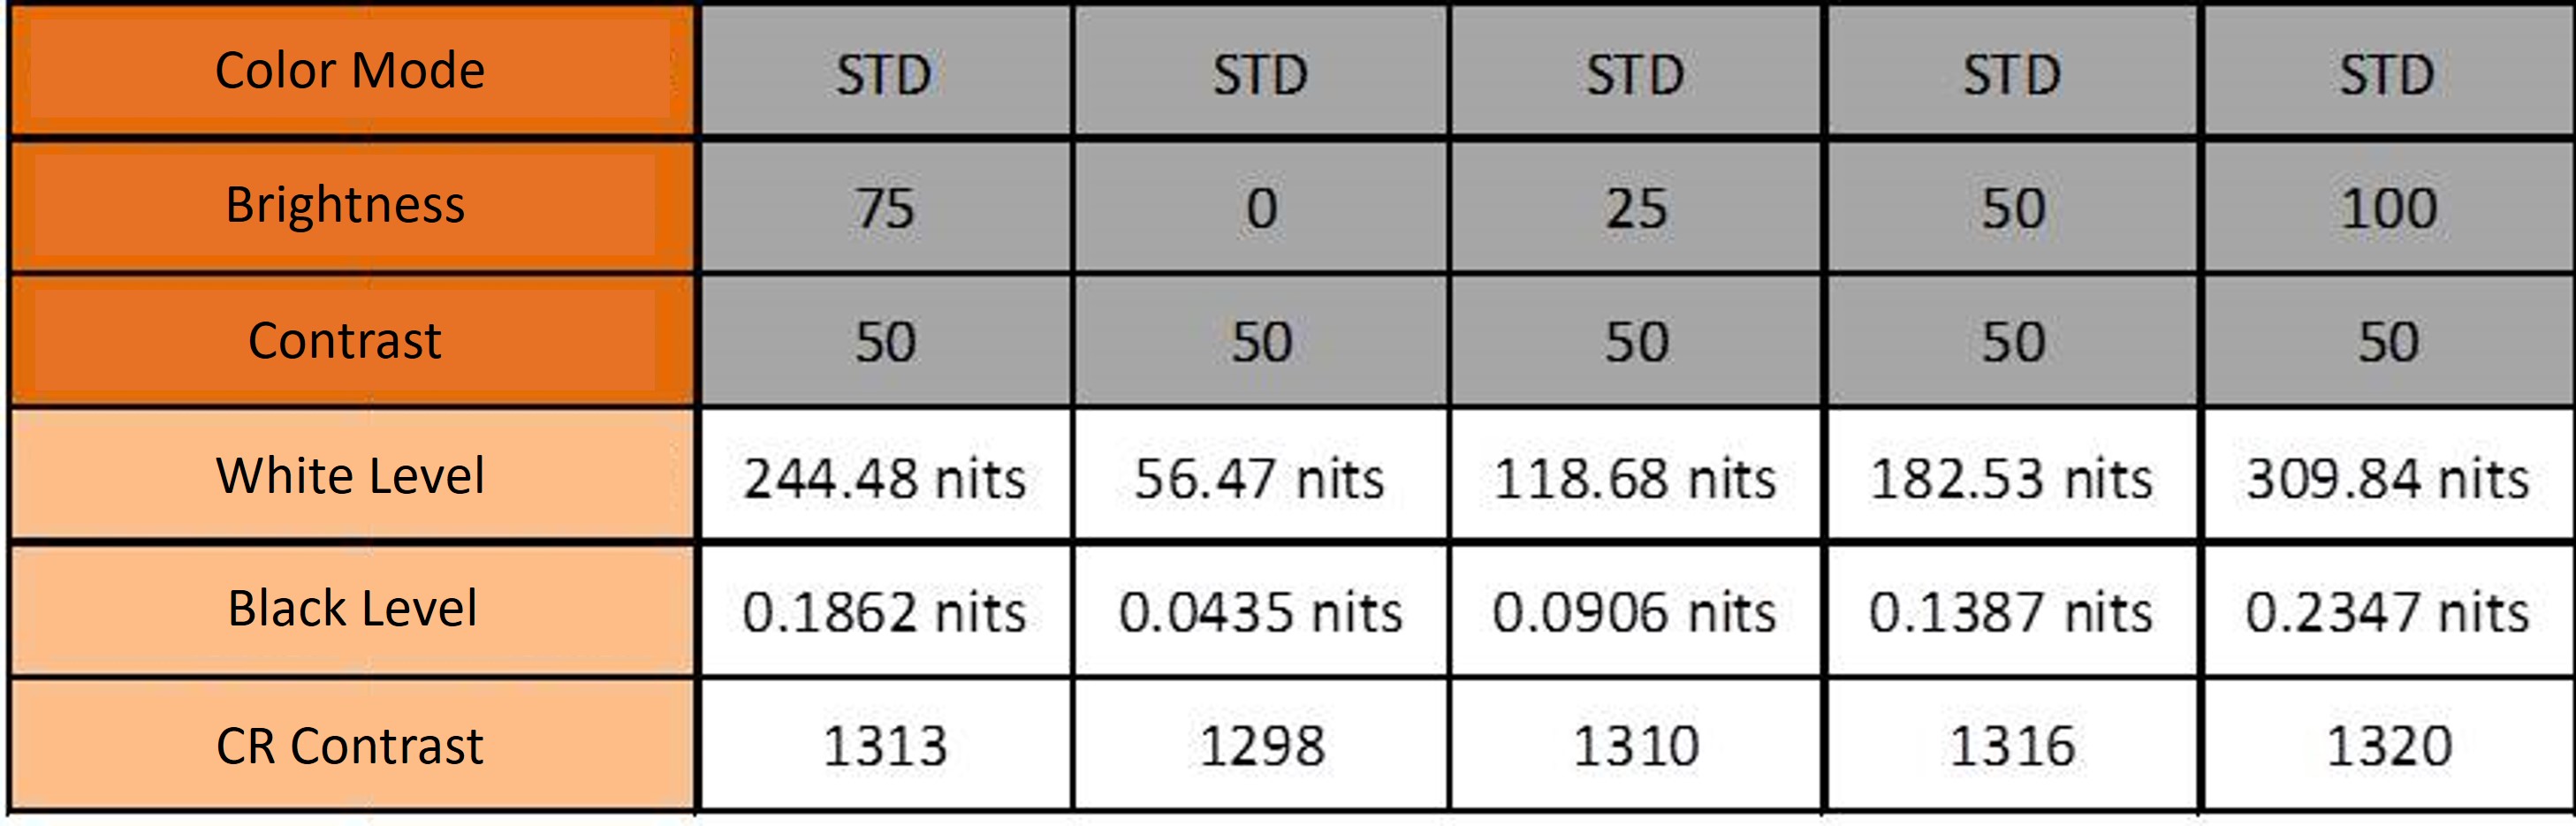
Now, let us focus on the increase or decrease of brightness for our experiments; in Standard mode, we measured the performance at the brightness of 0 / 25 / 50 / 75 / 100, and found that the contrast performance of the screen is still similarly consistent.
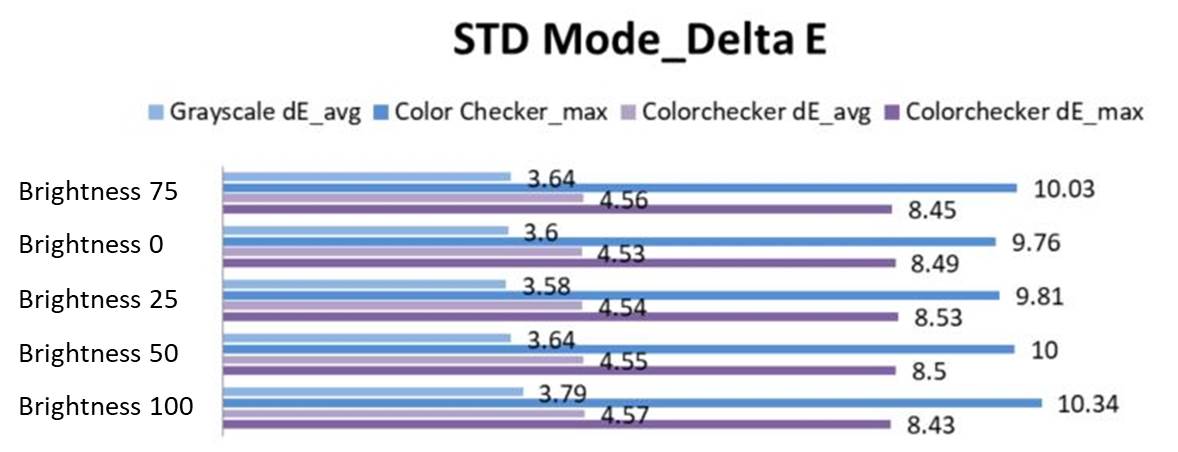
From the results in the table below, we can see that the performance of Delta E in Standard mode is also very consistent at different brightness settings.
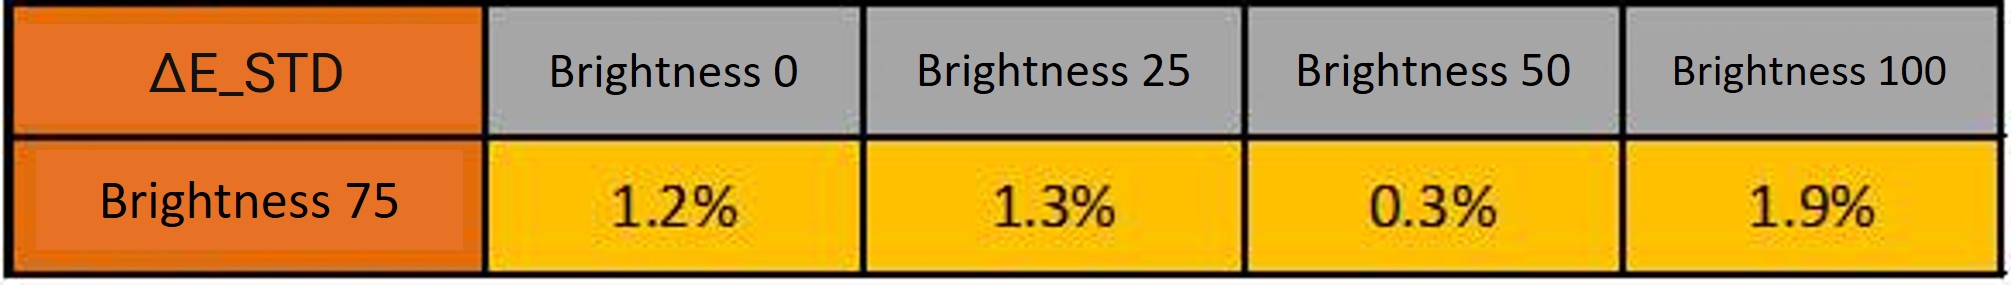
Compared to the differentiation at Brightness 75, we can see a similarly small difference.
From the foregoing results, we can see that although the Delta E of this screen is not very precise (ΔE <= 2), it can already meet general daily usage requirements; no matter what color mode and brightness value are set, it can achieve a consistent experience, which is a great point in its favor.
Allion Test Findings: TV
We also used a TV and performed the same experiment; different from screen settings, the TV monitor has an additional backlight setting. We still adjust to the default to measure differences in different color modes. We can see that the contrast values in different modes are different, with the biggest difference at a contrast value of 1096.
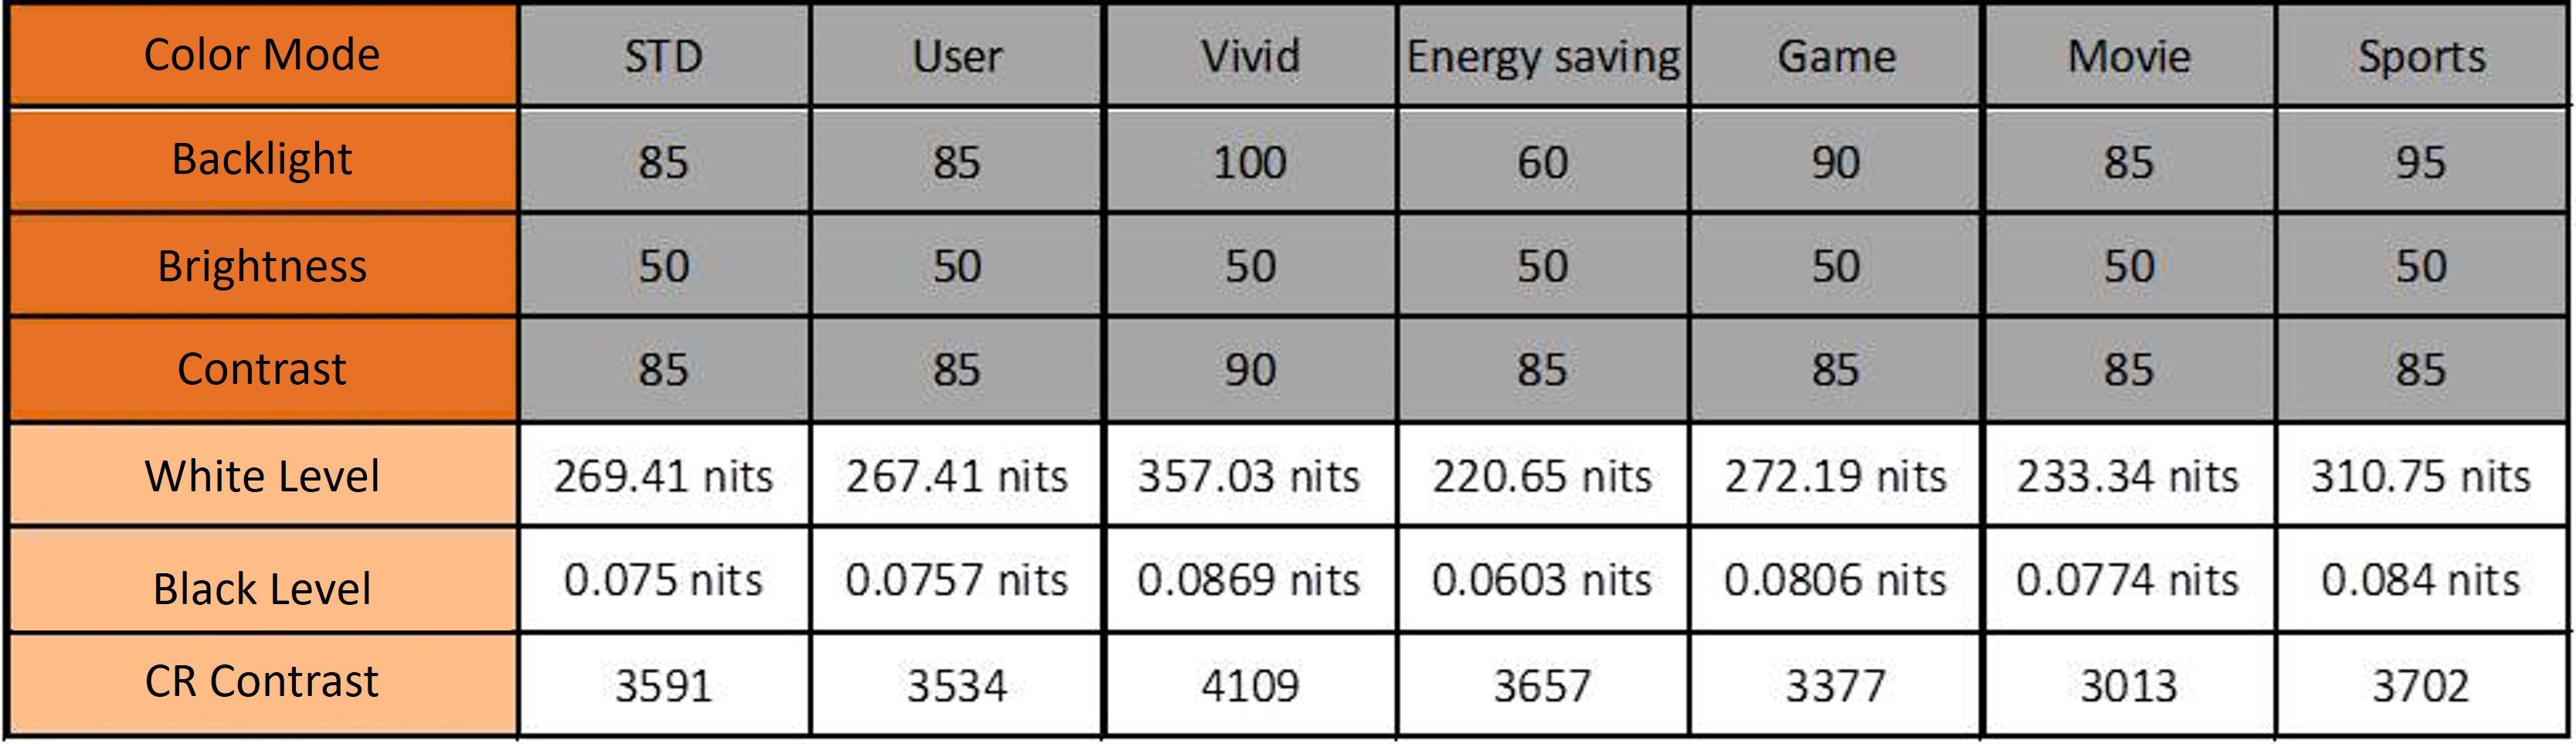
From the following table, we can see that the performances of all the other color modes aren’t very ideal, apart from the performance of Movie Mode. The worst is Vivid Mode, which had a shocking Grayscale_max performance of 84.45; this is quite unacceptable.
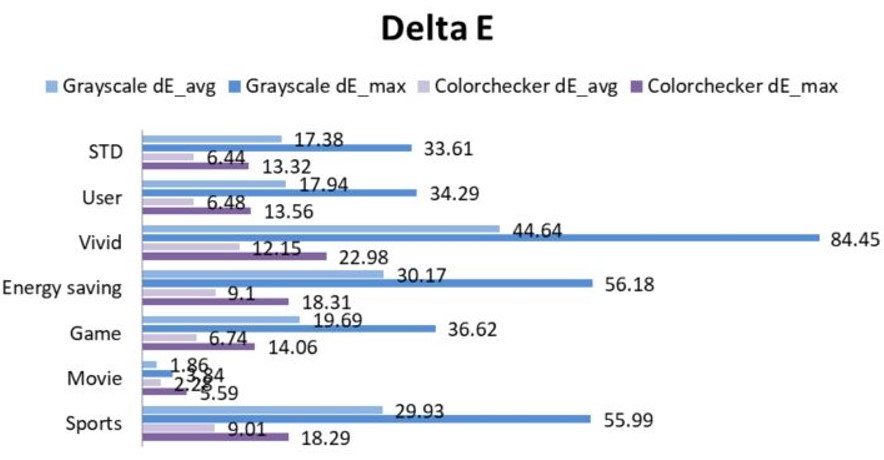
It doesn’t matter if the performance is bad when the performance is consistent across different modes and the user experience is almost similar so as to make it less noticeable. From the table below, we can see that the difference is really very big, making the experience very uncomfortable.

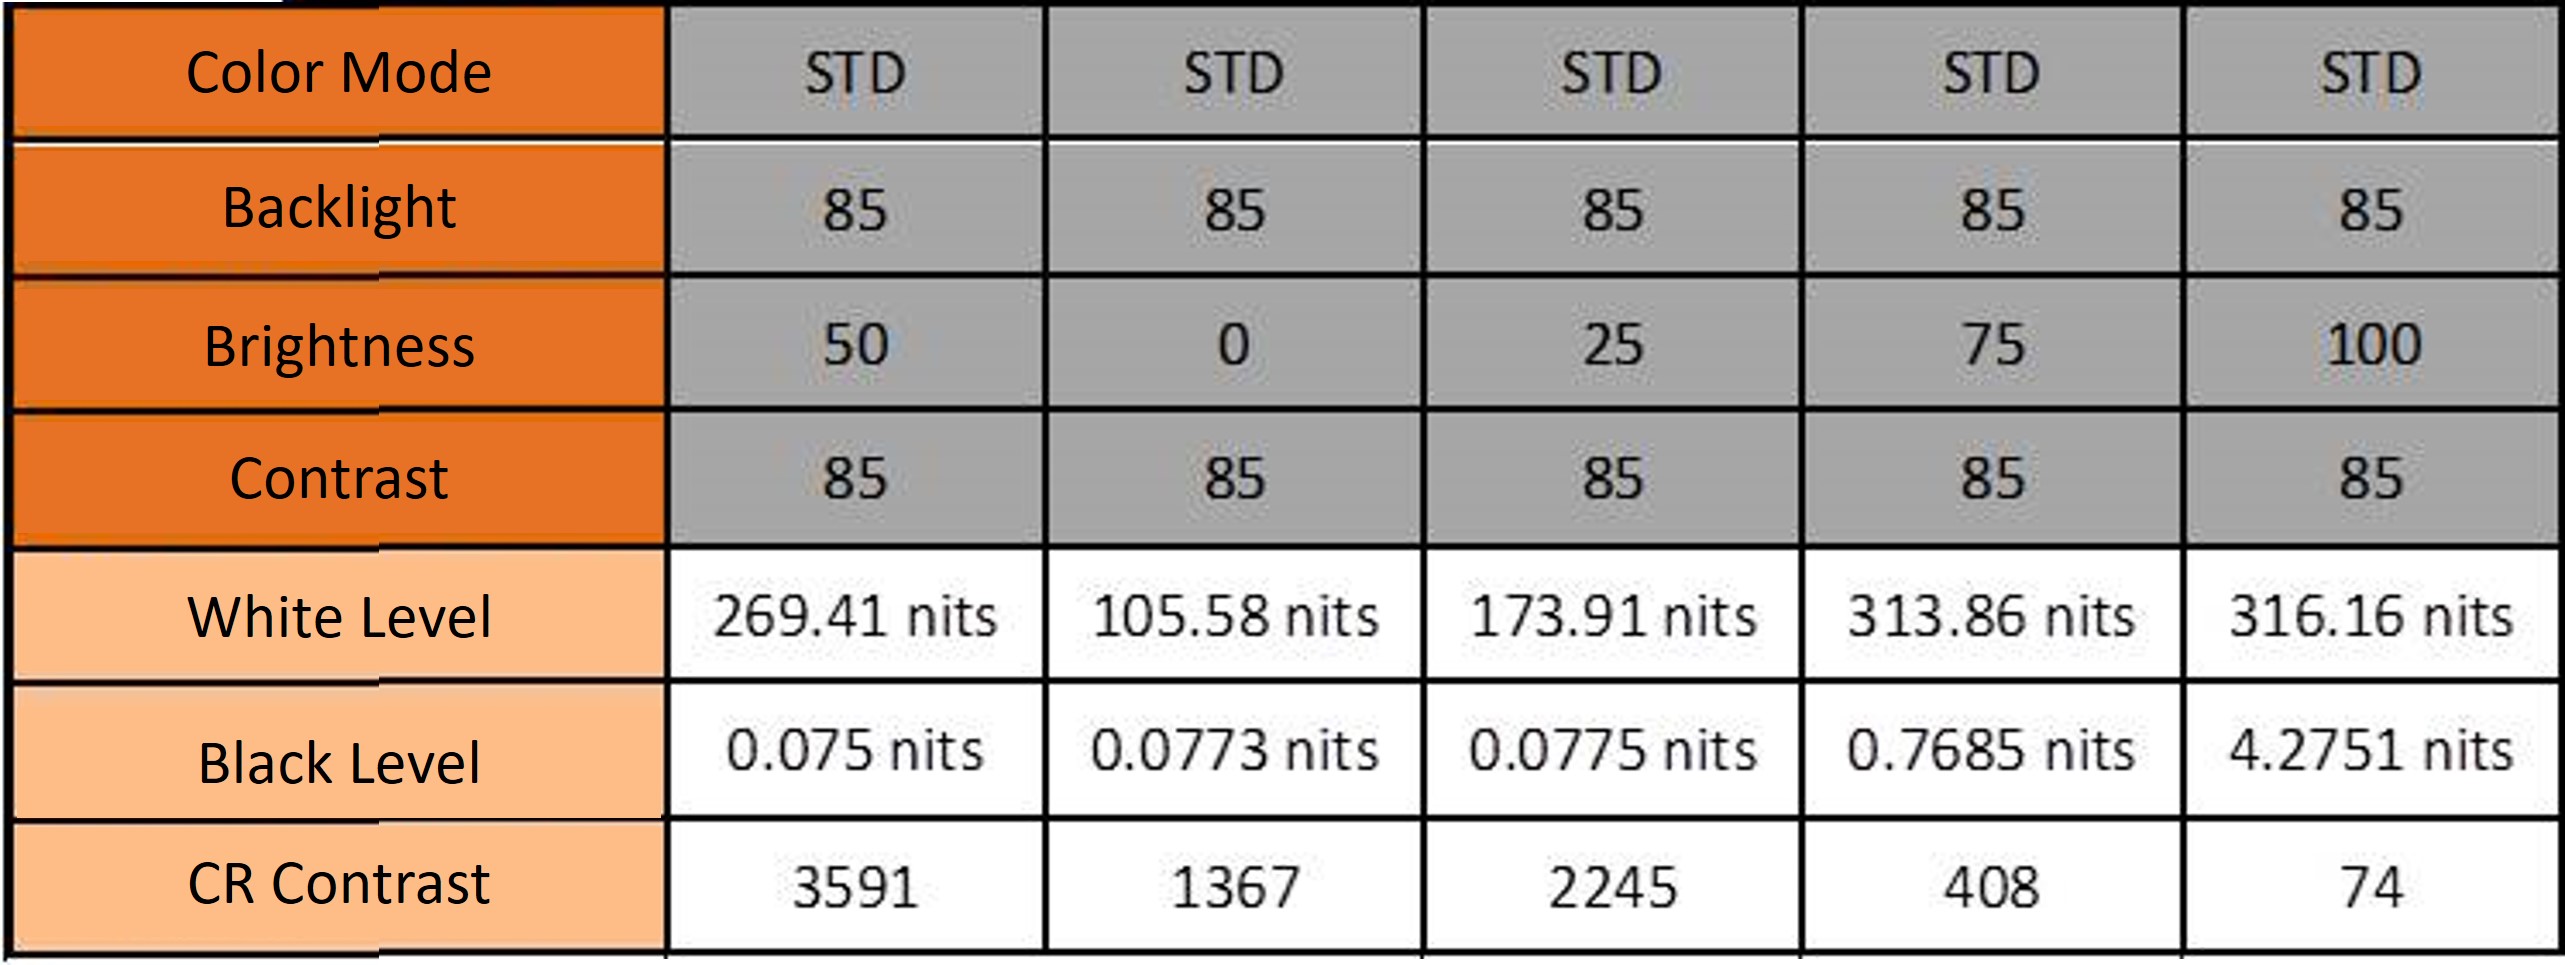
From the table below, we can see that the contrast performances of different brightness settings are really poor. In short, other than the default, simply adjusting the brightness will reduce contrast performance.
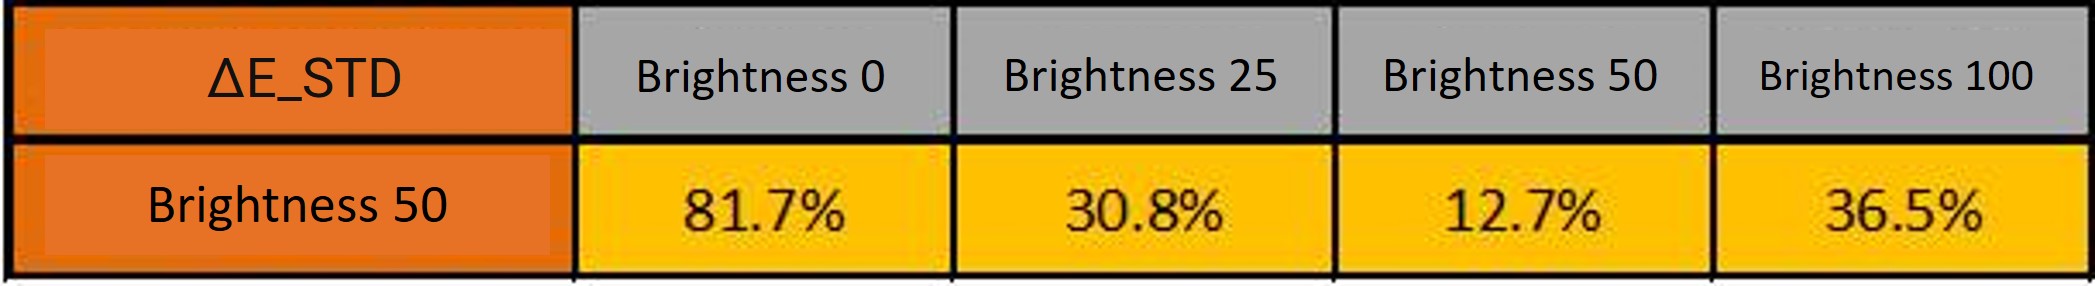
Different brightness performances in Standard Mode. Colorchecker’s Delta E performance is much more influenced by brightness, with the worst performance at brightness 0. Grayscale performance is very poor no matter what the brightness is.
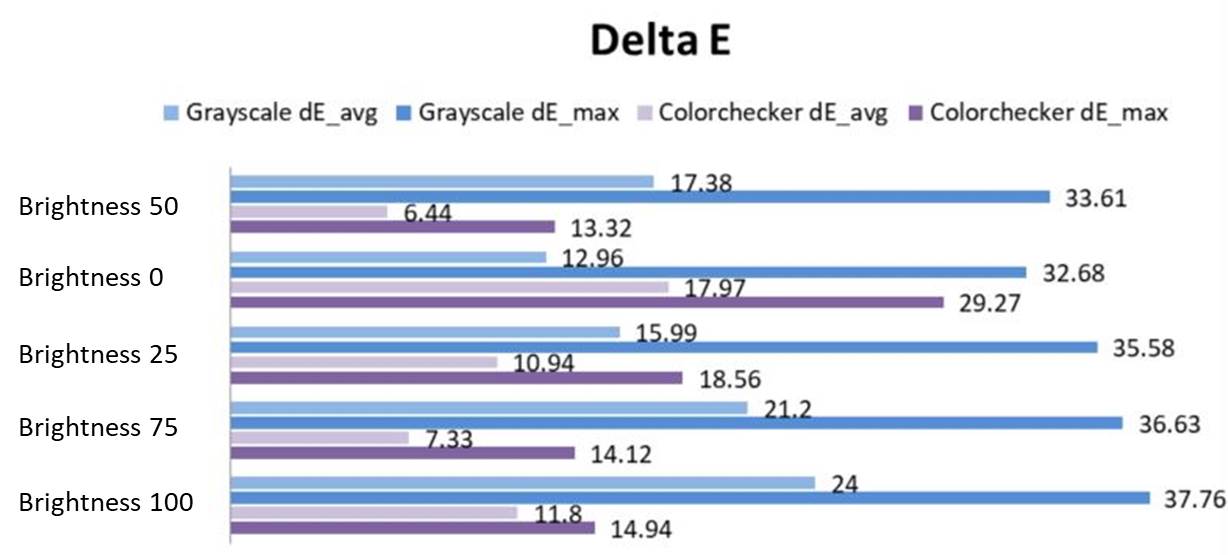
In terms of brightness performance consistency, the difference at brightness 0 reached 81.7%, which means that the performance is going to seem poorer in darker rooms with lights off.
Panel characteristics are such that, after factory calibration at the factory, color accuracy deviation will occur as usage times increase day by day. In general evaluations, we also measure the data before and after calibration. However, the reason we did not do this is that most users do not have a monitor calibrator for calibration. Most of the adjustments are merely performed through switching modes and brightness. So, we felt that experiments like this would be more relevant to the actual situation.
In addition to measuring brightness, contrast, and delta E performance, there are many other items (e.g. Gamma, color gamut, uniformity, etc.) that need to be measured and considered in order to get a comprehensive panel performance. We at Allion have been involved in panel measurement for many years. We recommend sending your products to our lab for full verification and evaluation before they are launched, just like performing a health check for your products, so that you can have full confidence in these products.
For more information on display and monitor testing, please see our Display Test Lab or fill out a contact form or email us.