


Allion Labs / Hank Lee
An increasing number of IoT products using Wi-Fi and Bluetooth® technology. More manufacturers are researching and developing products that have wireless functions and can be linked with smart phones. When selecting appropriate antenna, the manufacturer often determines the antenna to be suitable for its own product according to the specifications provided by the supplier. However, when the antenna is assembled on the product, the antenna frequency is shifted due to the mechanical housing or the mechanism material near the antenna.
Test Result
The product communication technology is Bluetooth® (operating frequency is between 2.4GHz-2.5GHz), and the product is glued to fix the housing and PCB board (Figure 1). Before the filling the glue, the antenna is already in the Bluetooth® frequency, and the offset of the antenna frequency to the lower band after the filling (Fig. 2).

Figure 1: Before filling the glue / After filling the glue

Figure 2: Return Loss
Why cause such a difference before and after the glue filling. Because the frequency of the antenna will cause frequency offset when passing through different material during resonance, the key is that the dielectric constant will increase after the glue filling, and the frequency will shift to the low frequency. Please refer to formula 1 to understand its physical characteristics.
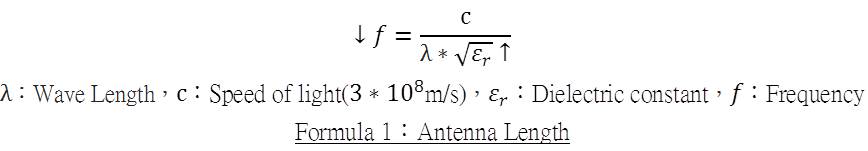
Formula 1: Antenna Length
The result of reducing the length of the antenna is as shown in the following figure (Fig. 4). The antenna frequency is adjusted to a high frequency before the glue is applied. After the glue is applied, the antenna frequency band is shifted to the low frequency due to the above physical characteristics, and it is located in the Bluetooth® working frequency band.

Figure 3: Return Loss
Below the result is that the efficiency of the low, medium and high frequencies in the Bluetooth® band is measured before and after the antenna adjustment (Table 1). Before the antenna adjustment, the measured efficiency is less than 10%, and the efficiency after adjusting the antenna. Increased to 45% or more, and improved by 35% before and after adjustment.

Table 1: Antenna Efficiency
The picture below shows the 2D pattern (Fig. 4) and the 3D pattern (Fig. 5). (Fig. 4) The pattern is weak and smaller than the Criteria Line before adjustment antenna. The pattern after the antenna adjustment is enhanced and the strongest in the 90 degree direction.

Figure 4: 2440MHz 2D pattern

The left 3D pattern of Figure 5 is the antenna before the adjustment. It can be observed that the pattern strength is weaker and less close to omnidirectional, as indicated by the yellow line in the figure. The right side of Figure 8 is the 3D pattern after antenna adjustment. The pattern is stronger than the unadjusted and the pattern is closer to omnidirectional, as indicated by the yellow line in the figure.
How to judgment the Antenna standards
The following two parameters can be used to initially determine whether the antenna meets the frequency band to be broadcast by the product.
- VSWR
- Return Loss
Further to determine the quality of the antenna needs to be based on the following two parameters.
- Efficiency
- Pattern
How to measure the antenna
- The Vector Network Analyzer (VNA) measures the two parameters VSWR and Return Loss.In order to confirm whether the antenna is in the working frequency.

Figure 6: Antenna test site and erection diagram
- The 843 chamber uses the Great Circle Cut architecture to test antenna efficiency and pattern. The test software is the automatic measurement software developed by Allion. Simply fixing the product to be tested on the turntable, the antenna efficiency and antenna 2D and 3D radiation patterns can be accurately measured.
 Figure 7 :Antenna test site and erection diagram
Conclusion
The antenna of an IoT product may be offset due to different mechanical structures or materials. The following problem will occur.
- Unable to connect.
- The product will consume more power.
- If the distance increases, product will not be connected.
- Use distances to shorten at certain angles or areas.
These problems cause a bad user experience to make customers complain, users will question the product quality of the manufacturer and affect the brand.
Allion provides a full testing services to help you identify problems more quickly during the product development phase to avoid many customer complaints and help you improve your market competitiveness.