


Allion Labs
Most wireless products these days support Wi-Fi 4 and 5, yet with the 2020 announcement of Wi-Fi 6 and 6E, more products equipped with Wi-Fi 6 and 6E are being released. Wi-Fi 6/6E provides users with advantages, such as higher transmission speed, lower latency, and higher capacity. Many products, including the newest VR/AR technologies, are sure to benefit from the newest Wi-Fi upgrades.
The most obvious difference between Wi-Fi 6 and 6E lies in their operation frequency bands. Wi-Fi 6E extends the available frequency range to 6GHz, while Wi-Fi 6 operates in the 2.4GHz and 5GHz bands. The 6GHz band is much less crowded than the 2.4GHz and 5GHz bands, which means that Wi-Fi 6E is less susceptible to interference, thus reducing the problem of coexistence interference with other products. In other aspects, there is not much discrepancy between the two.
| Wi-Fi 6 | Wi-Fi 6E | |
| Frequency Band | 2.4GHz/5GHz | 6GHz |
| Bandwidth (MHz) | 20/40/80/160 | 20/40/80/160 |
| Modulation Mode | OFDMA | OFDMA |
| Highest MCS Rate | MCS11 | MCS11 |
Table 1: Comparison of Wi-Fi 6 and Wi-Fi 6E Wireless Technologies
The usage of the 6GHz band makes available an extra 1200MHz of bandwidth, rendering the previous 2.4GHz to 5GHz channel tables obsolete. Figure 1 shows the new table in detail, where the new channels for the new band have been renumbered.
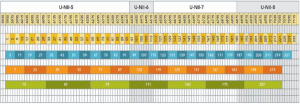
Figure 1: Wi-Fi 6E Channels
The 6GHz band offers up to 59 20MHz channels, which increases the time needed to connect to the AP since all channels are scanned. To reduce the time required to connect, Wi-Fi 6E incorporates the concept of preferred scanning channels (PSC), giving priority to 15 preferred channels, specifically Channels 5, 21, 37, 53, 69, 85, 101, 117, 133, 149, 165, 181, 197, 213, and 229. When using different bandwidths, PSCs should be set up within the bandwidth, so that Wi-Fi 6E can detect and establish a connection.
Since the 6GHz band is a new band, the current market does not offer many Wi-Fi 6E compatible products, leading to insufficient empirical data for reference and performance evaluations. To ensure that manufacturers can verify Wi-Fi 6E products and evaluate performance in a timely manner, Allion Labs now provides Wi-Fi 6/6E OTA testing services, which evaluate overall product performance through the values acquired from Total Radiation Power (TRP) and Total Isotropic Sensitivity (TIS). The Wi-Fi 6/6E OTA will be performed in 843 reflection-free radio darkrooms, with the Wi-Fi 6E connection established via a base station emulator (R&S CMW500 equipped with R&S Z800A). Figure 2 shows the Mini PC equipped with an Intel Ax210 module, set up in a 843 reflection-free radio darkroom for conducting the Wi-Fi 6E OTA test.
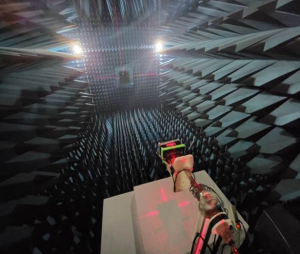
Figure 2: Mini PC set up in 843 Chamber with coordinates axes
Table 2 shows the actual OTA data test conditions of the Mini PC equipped with Intel Ax210. The data rate tested in TRP is MCS0, while the data rate of TIS is MCS11.
| Standard | BW (MHz) | Channel | TRP (dBm) | TIS (dBm) |
| 802.11 ax 2.4GHz | 20 | 6 | 16.98 | -58.1 |
| 40 | 8 | 12.9 | -58.9 | |
| 802.11 ax 5GHz | 20 | 36 | 13.69 | -60.5 |
| 40 | 38 | 13.15 | -56.2 | |
| 80 | 42 | 13.96 | -53.8 | |
| 160 | 50 | 14.52 | -53.7 | |
| 802.11 ax 6GHz | 20 | 37 | 0.69 | -58.2 |
| 40 | 35 | 3.33 | -55.3 | |
| 80 | 39 | 6.37 | -51.6 | |
| 160 | 47 | 11.52 | -52.7 |
Table 2: Wi-Fi 6/6E OTA Data
Figure 3 shows the Wi-Fi 6/6E TRP graph comparison. From the graph, we can see the differences in TRP values under different standards and BW. From Figure 3, we can see that the TRP values of 2.4GHz and 5GHz are stronger at 20MHz but weaker at 6GHz. However, the TRP values of 6GHz become gradually stronger as the bandwidth becomes wider. As for the phenomenon observed in Figure 3, the TRP values are weaker in the narrow bandwidth conditions of Wi-Fi 6E. The reason is that FCC has enacted regulations regarding the emitted energy of the client device, as shown in Table 3 below. The power spectral density is defined here as “-1dBm/MHz”. Consequently, the narrower the bandwidth, the weaker the radiation energy becomes. Figure 4 shows the Wi-Fi 6/6E TIS Comparison Chart, which can also be used for observing the differences in TIS values under different standards and BW through the bar chart. The blue bars indicate the 2.4GHz TIS values; the red bars indicate the 5GHz TIS values; the yellow bars indicate the 6GHz TRP values. From Figure 4, we can see that when the bandwidth is wider, the measured TIS value will be relatively lower in order to maintain better signal quality.
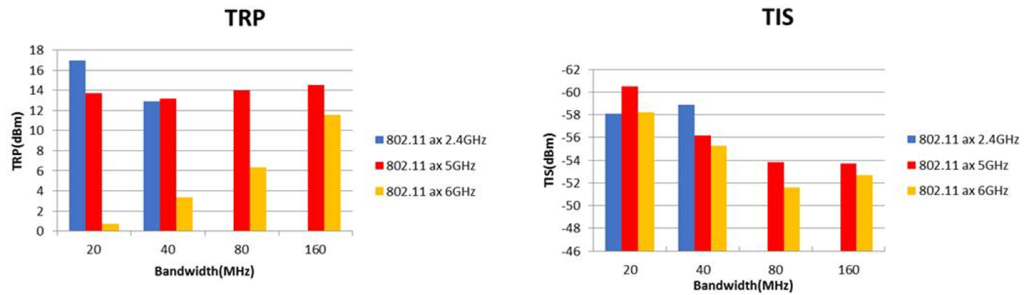
Figure 3: Wi-Fi 6/6E TRP comparison (left) and Wi-Fi 6/6E TIS comparison
| Device Class | Operating Bands | Maximum EIRP | Maximum EIRP Power Spectral Density |
| Client connected to low-power access point | U-NII-5 (5.925–6.425 GHz) U-NII-6 (6.425–6.525 GHz) U-NII-7 (6.525–6.875 GHz) U-NII-8 (6.875–7.125 GHz) |
24 dBm | -1 dBm/MHz |
Table 3: FCC regulations regarding the 6GHz band of the client device
Figures 5 and 6 show the radiation field patterns of the TRP and TIS of 6GHz Channel 37 respectively. The results of the radiation field patterns can be used for understanding the overall radiation of the object to be measured, and then be used for locating the blind spots of the antenna.
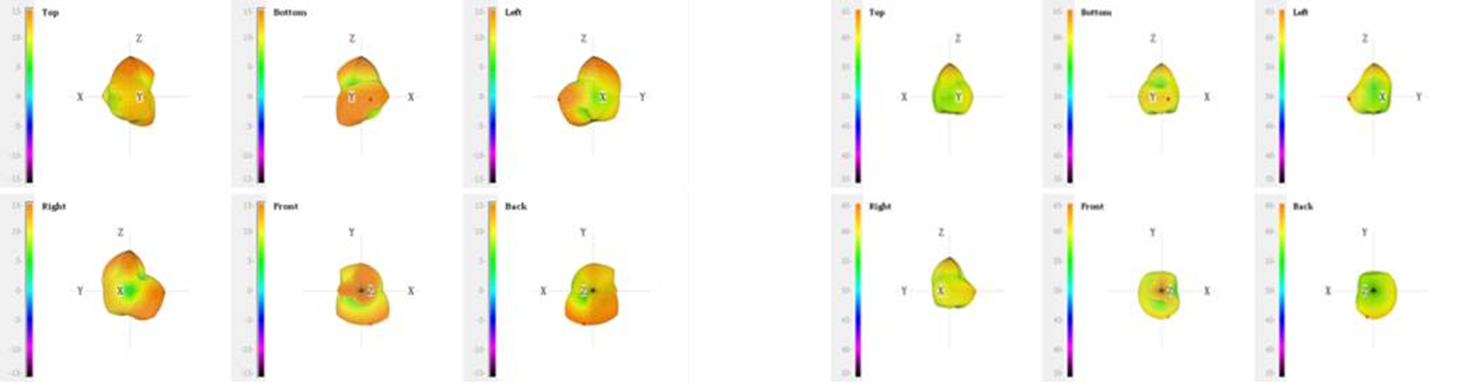
Figure 4: Wi-Fi 6E TRP Patterns (left) and Wi-Fi 6E TIS Patterns
Through the OTA Test, we can learn about the wireless performance of a product in advance, so as to prevent irreparable loss due to poor performance. Only by understanding the wireless performance of a product can we effectively reduce the occurrence rate of customer complaints. Allion Labs can help you verify the Wi-Fi wireless performance of your products, to improve or prevent any bad performance of your products earlier at the development stage by using TRP and TIS values and pattern models, thereby enhancing your market competitiveness.
If you have any product questions or OTA testing needs, you are welcome to contact us: service@allion.com, or click the here to contact Allion easily!