


The best and most intuitive way to evaluate the performance of a tablet is by using benchmark software like 3D Mark, AnTuTu, and PC Mark. The results will reveal how each tablet performs in various areas, including CPU, GPU, memory, HDD, or network.

Benchmark Software
In this article, Allion will discuss the results and differences in the performance of 5 tablets using different benchmarking software. We ran the tests without changing the default settings of the tablets. First, we will use 3D Mark, the tool most familiar to users. It tests the performance of GPUs while testing the performances of other hardware. Below are the test results:
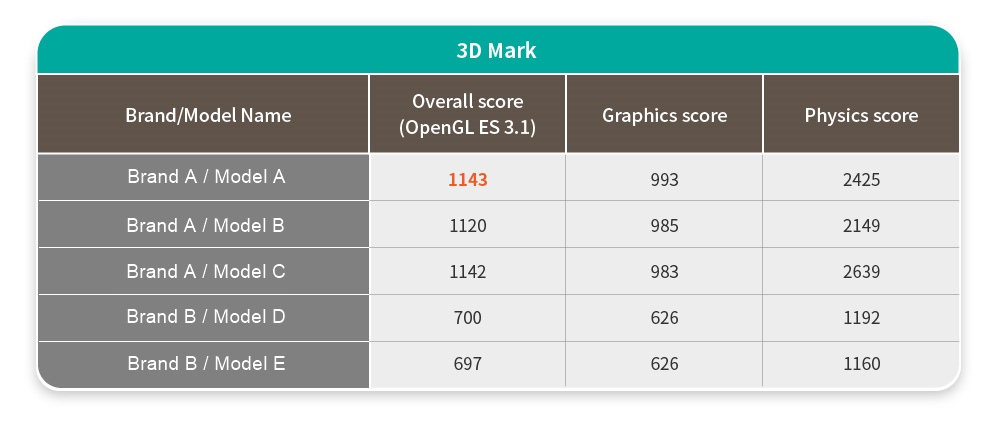
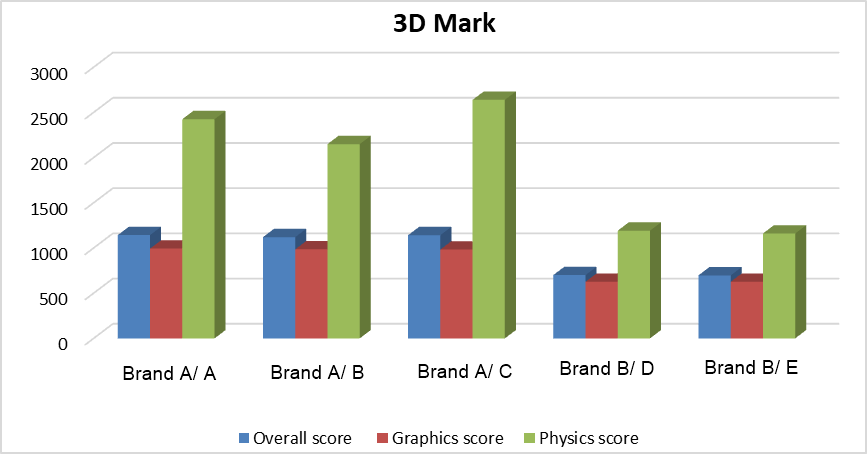
3D Mark Scores of the Tablets
The test results show similar performance across the three Brand A tablets, all of which did approximately 1.6 times better than the Brand B tablets. Whether in graphics or hardware, the Brand A tablets performed better.
Next, we use AnTuTu to test the performance of CPU, GPU, MEM, and UX.
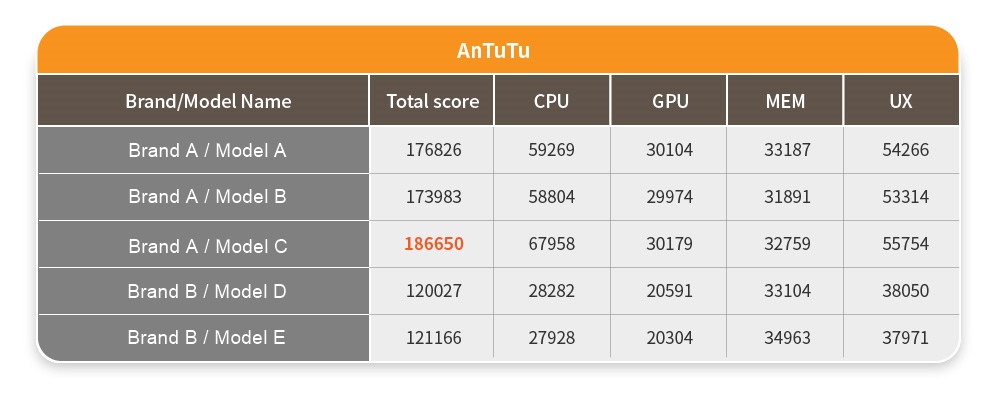
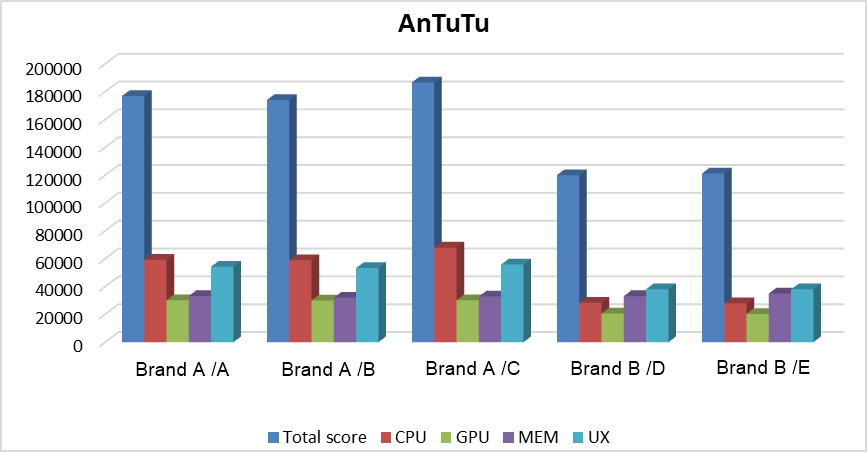
AnTuTu Scores of the Tablets
The test results show that the scores of the Brand A tablets are all about 1.45 times higher than the scores of the Brand B tablets. The difference between the Brand A tablets had been unnoticeable in 3D Mark, but in AnTuTu, the difference between the Brand A models is more noticeable, particularly in the CPU. This is why tests should be done on multiple benchmark software: only through multiple tests can one see the minor differences between tablet performances.
The third software is PCMark for Android, where the tablets will be tested on six different indicators of work, web browsing, video editing, writing, photo editing, and data manipulation. The results are shown below:
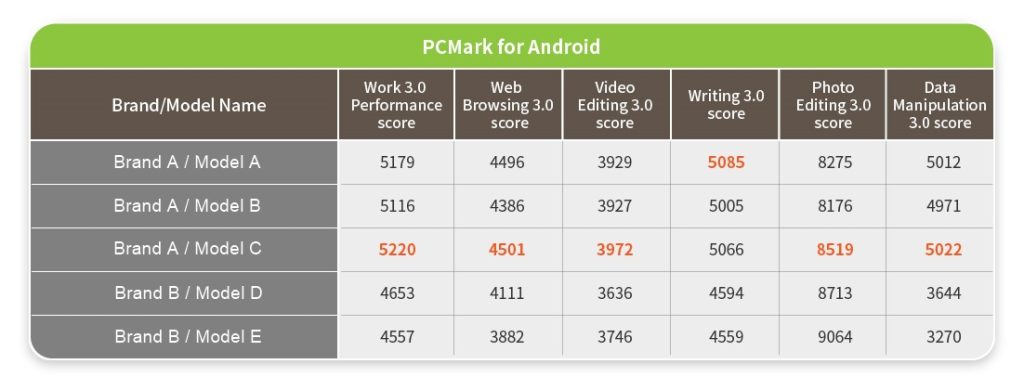
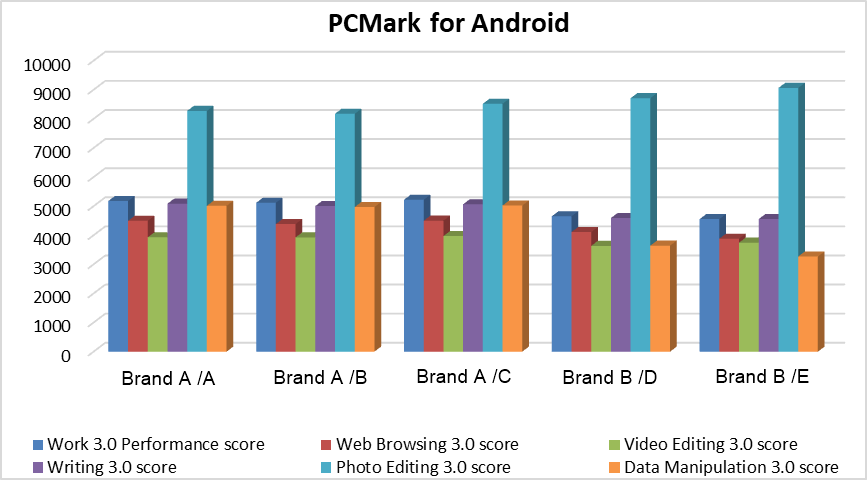
PCMark for Android Scores of the Tablets
As PCMark tests for different indicators than the previous hardware tests, the results are slightly different. There is less of a difference between the performance of the Brand A tablets and the Brand B tablets, yet the Brand A tablets still perform slightly better than the Brand B tablets.
The last benchmark software we use is GFXBench, a 3D graphics performance benchmark mainly for seeing how a device’s 3D gaming graphics performs. GFXBench creates complicated effects to test how the GPU performs in 3D graphics during games or other GPU-intensive tasks such as UI rendering or navigation. The test results are as follows:
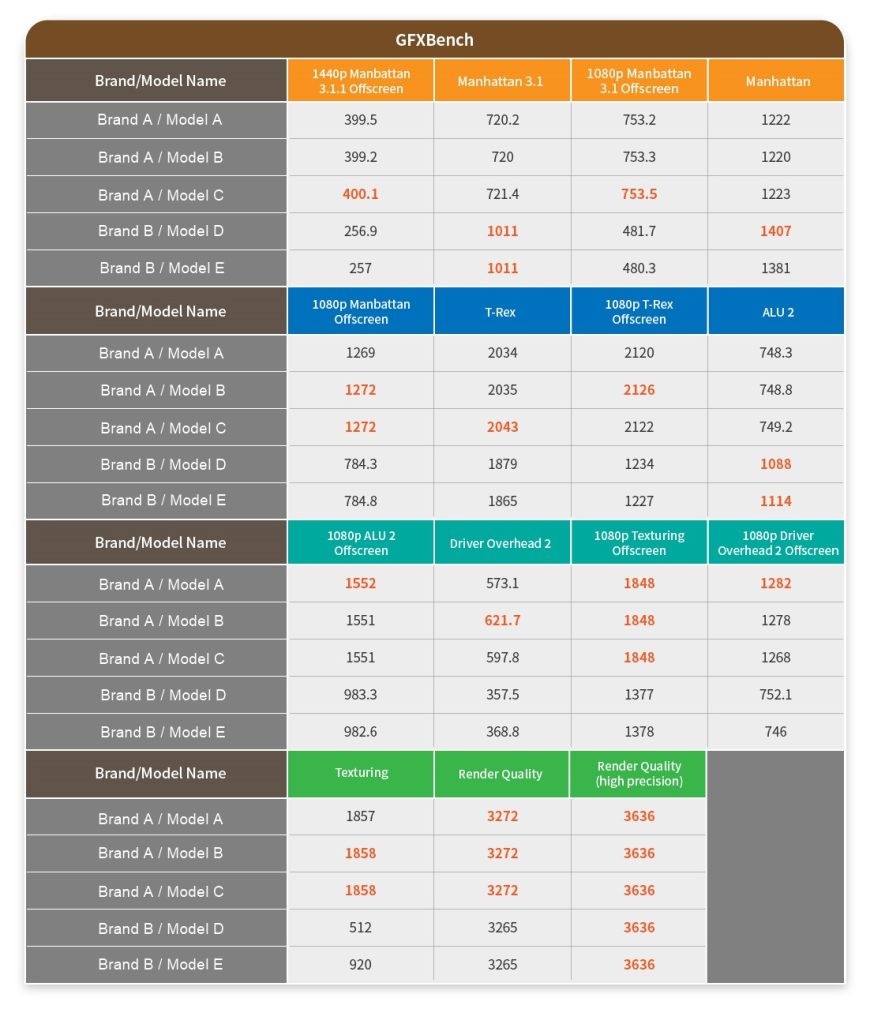
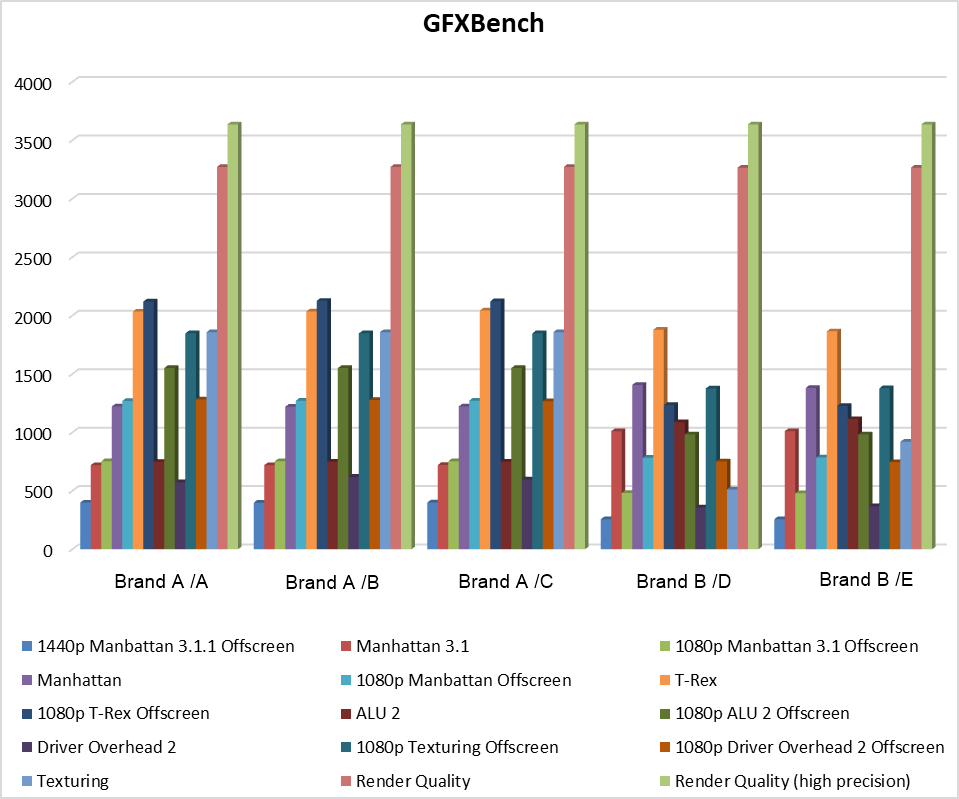
GFXBench Scores of the Tablets
Across the 15 GFXBench test items, the Brand A tablets still did better overall, with a few items like ALU 2 where the Brand B tablets attained better results.
The benchmark tests above do not cover everything; there are many other benchmark software that test different device functions, such as Geekbench, NenaMark2, Vellamo Mobile Benchmark, Androbench, and CF-Bench. In this article, we have merely provided some of the most commonly used benchmarks for these five tablets. If you have any questions or requirements, please contact Allion.
Read More│
Comparing Battery Life and Charging Behavior of Different Tablets
Reviewing Wireless Network Performance of Different Tablets
Comparing Displays and Cameras of Different Tablets
Comparing the User Experience of Tablets