


In the previous article, we compared R&S CMW500 and Z800A to discuss the OTA performance of Intel AX210. After the tests, we discovered several potential issues. For example, within the 6GHz frequency band, it’s necessary to install the Z800A on the CMW600 as an accessory, on top of that, you could only perform the 6GHz test after setting the compensation value. Not only does this increase the complexity of the entire setup, but it also may cause data errors because no additional compensation value is set in the process. In addition to this, the compatibility between the R&S CMW600 and the wireless AP is not that good. This will make it even more difficult for the instrument to establish a connection with the AP. The execution time of the test is also very long, which leads to low efficiency.
To improve the issues mentioned above, we tried to change the R&S CMW500 to the Anritsu MT8862A for Wi-Fi OTA testing after multiple evaluations. After replacing it, not only does it require additional installation and configuration of additional equipment, but also the compatibility to various wireless APs improved greatly. There was also a significant improvement in the test duration, improving the test results’ stability.
Wi-Fi 6/6E is the first Wi-Fi protocol to utilize OFDMA technology. Wi-Fi 6/6E also has a function similar to LTE’s resource allocation. This function is called “Resource Units (RU)”, meaning that the bandwidth of 20MHz, 40MHz, 80MHz, and 180MHz can be cut into RUs of different sizes and then allocated to different users with different needs, so that the spectrum can be utilized efficiently. The most common RU sizes are 26-tone RU, 52-tone RU, 106-tone RU, 242-tone RU, 484-tone RU, and 996-tone RU (shown in Figure 1), and each group of RU can be seen as one user. For example, when the bandwidth is 160MHz and under 26-tone RU, a maximum of 37 users can transmit simultaneously.
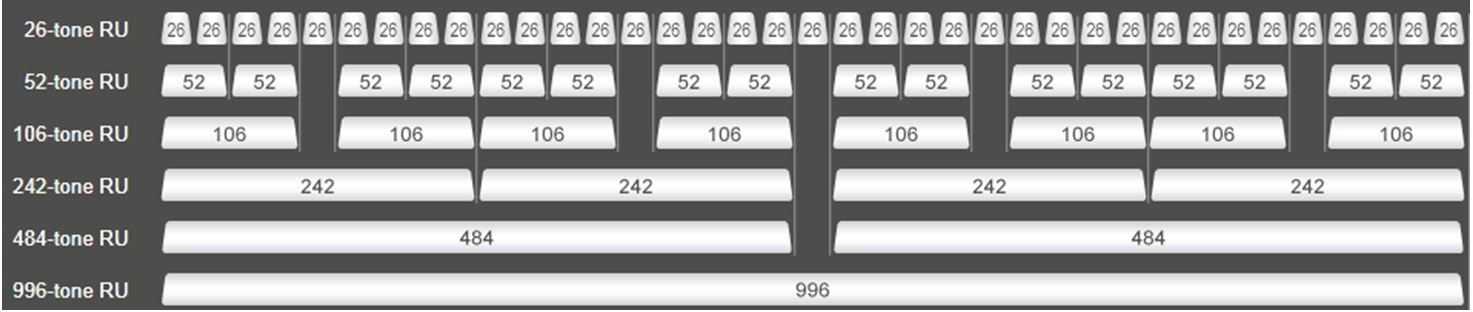 Figure 1: RU Table for 160MHz
The newly added 6GHz frequency band is divided into U-NII 5, U-NII 6, U-NII 7, and U-NII 8. Currently, the U-NII 5 and U-NII 7 frequency bands are mainly used for satellite communications and point-to-point public service communications. The U-NII 6 and U-NII 8 frequency bands are mainly used for news broadcast vehicles and TV stations. To avoid interference from the new Wi-Fi frequency bands, the FCC has set specifications for emissions as shown in Table 1. It’s necessary to comply with these specifications before using the 6GHz band. If the specifications cannot be met, you cannot put your product on the market.
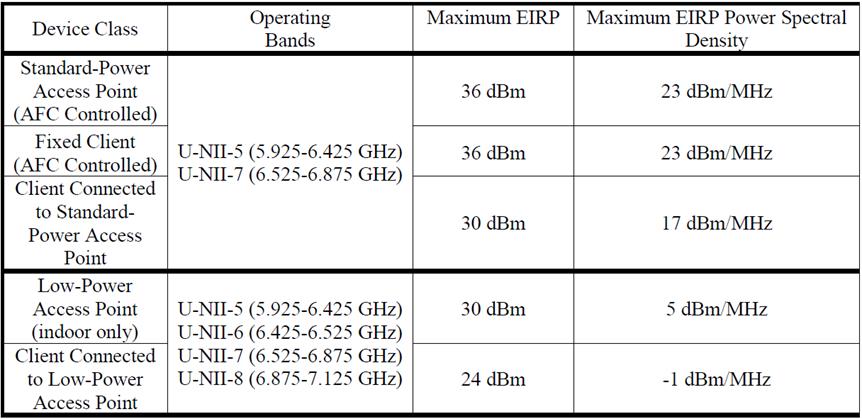
Table 1: FCC Regulations for Emitting Energy in the 6GHz Band
Performance Comparison:
In the first quarter of 2020, Intel first launched the AX210 6E wireless network card. At the time, products that supported Wi-Fi 6/6E were quite rare. Almost all of the products that used Intel chips were laptops, and only a few mobile phones used them. This was the case until Broadcom utilized Wi-Fi 6/6E in the Pixel 6 Pro and Samsung S21 Ultra chips. After that, mobile phones gradually implemented Wi-Fi 6/6E support. However, looking at the big picture, there aren’t that many products in the market that support Wi-Fi 6/6E. This is because Wi-Fi 6/6E is still relatively new and its OTA performance is difficult to evaluate.
Allion conducted Wi-Fi 6/6E OTA tests on the Pixel 6 Pro and the Samsung S21 Ultra. The performance of the Wi-Fi OTA is evaluated through Total Radiation Power (TRP), Total Isotropic Sensitivity (TIS), and Patterns.
We performed the test in an 843 anechoic chamber and established a Wi-Fi 6/6E connection with the Anritsu MT8862A. Figure 2 shows where the mobile phone was set up in the 843 anechoic chambers.
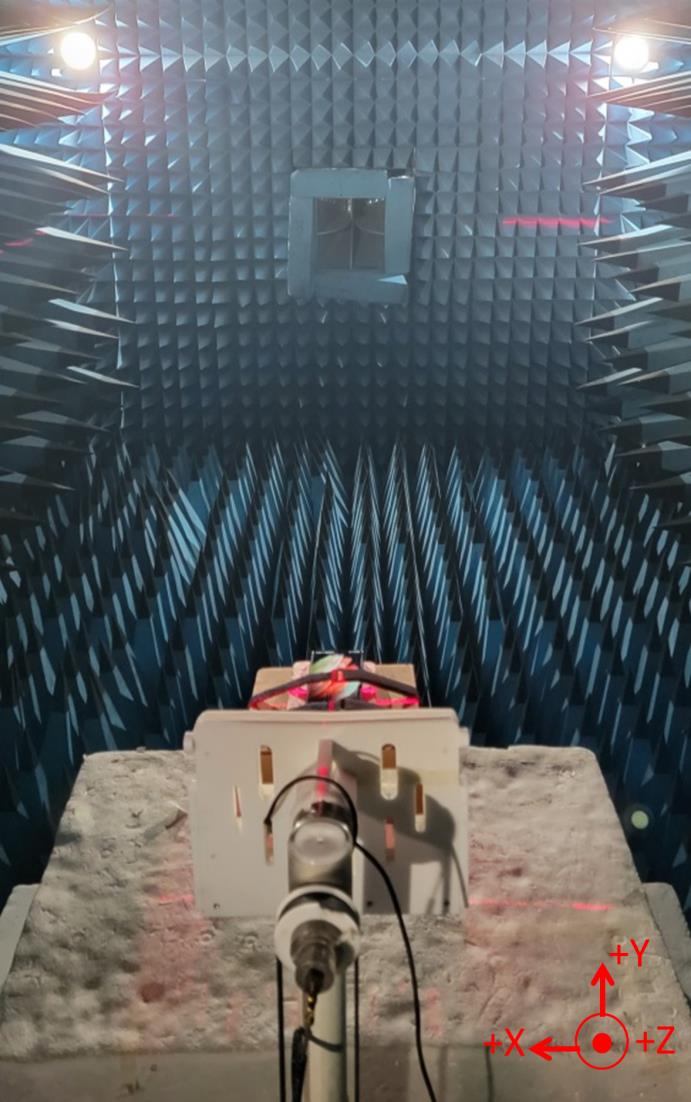
Figure 2
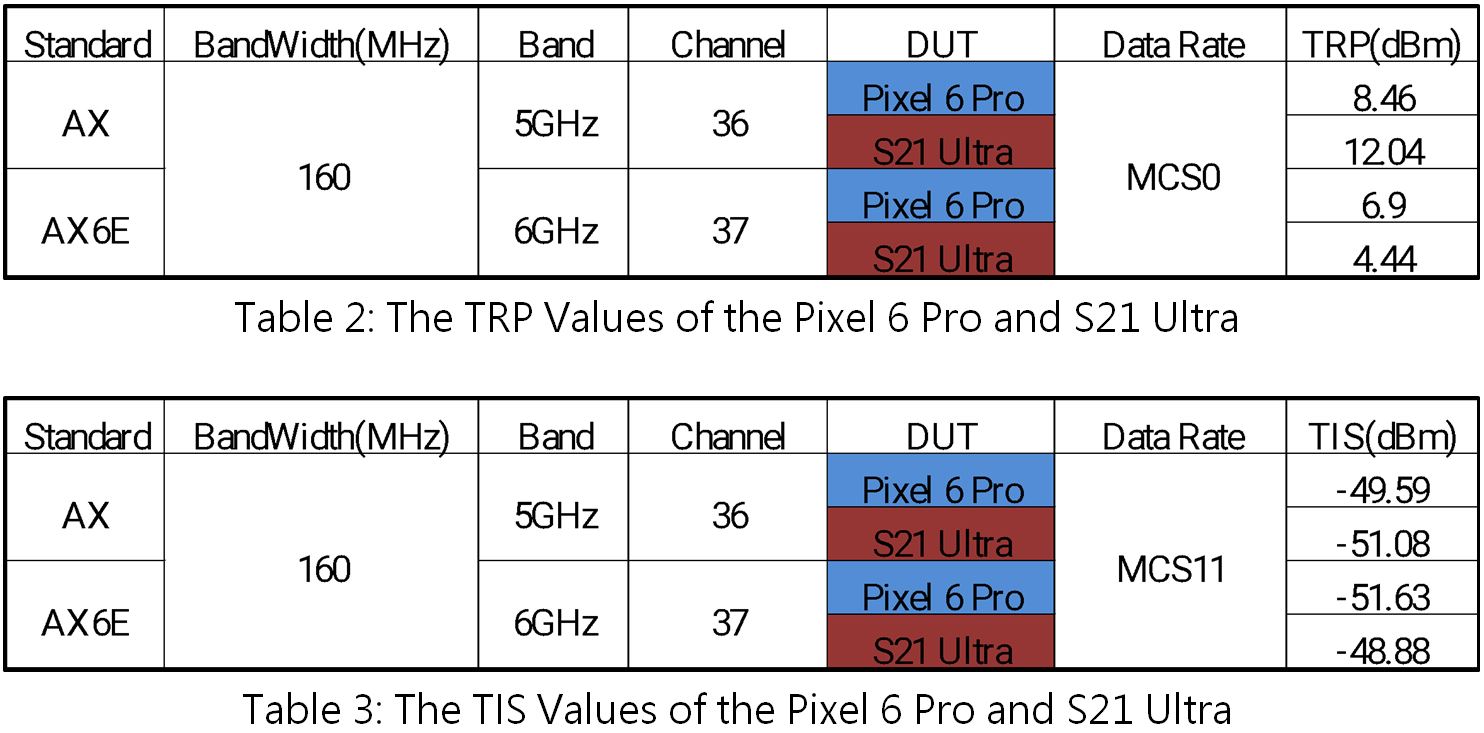
Figure 3 is a comparison of the overall OTA performance of the Pixel 6 Pro and the Samsung S21 Ultra in the 5GHz frequency band. It can be seen in both the TRP and TIS comparison that the performance of the S21 Ultra is better than the Pixel 6 Pro.
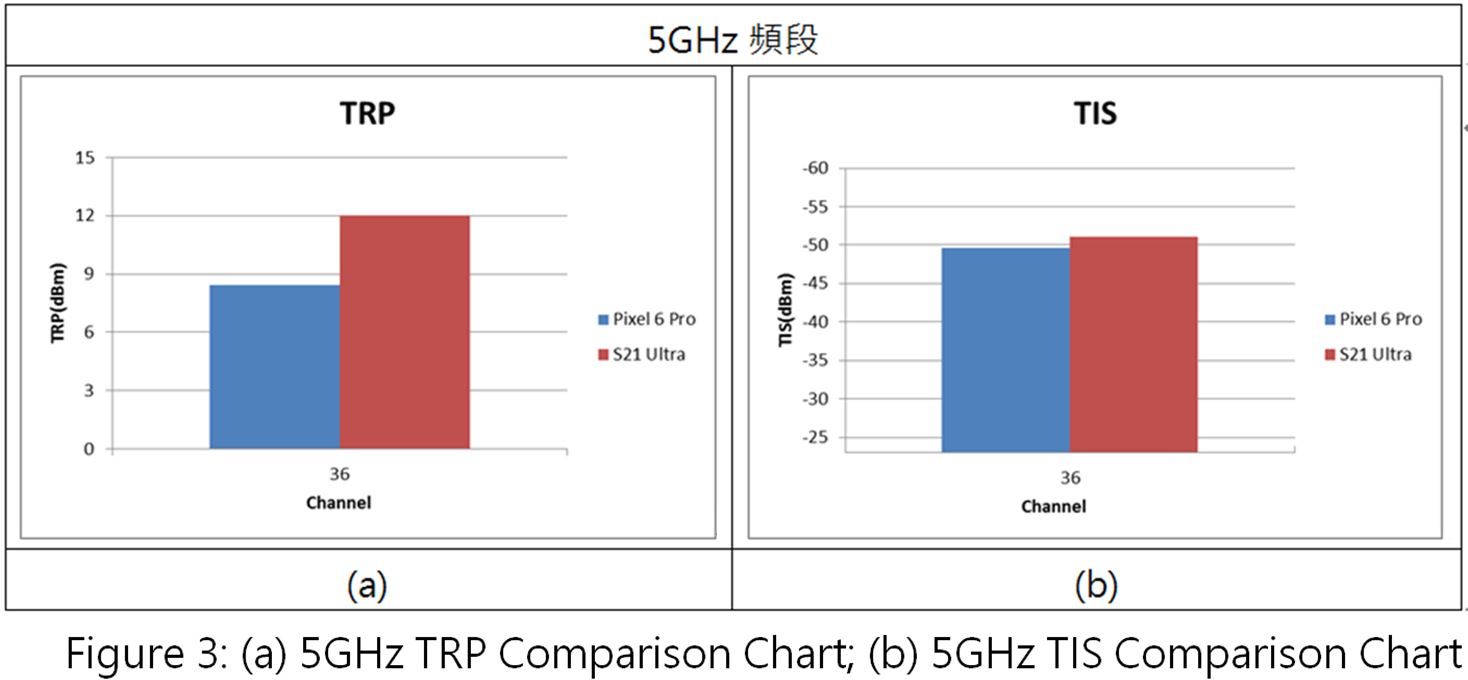
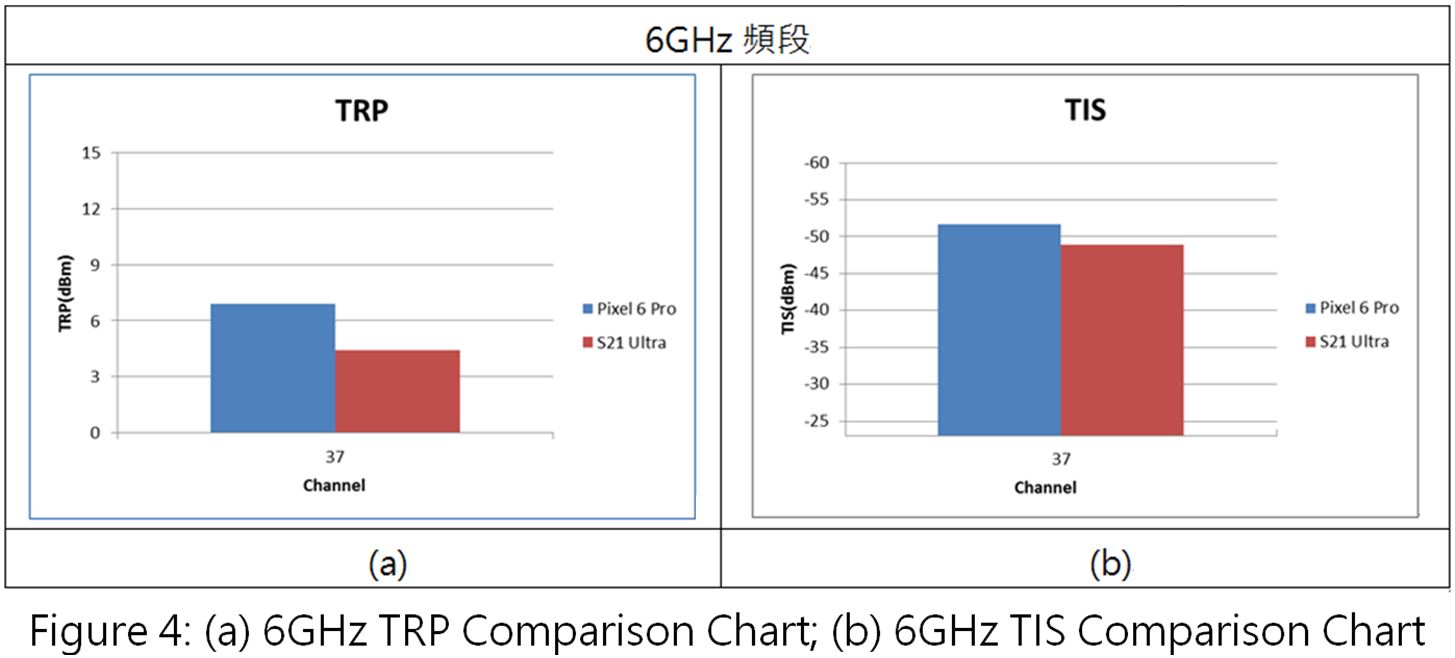
Figure 4 is a comparison of the overall OTA performance of the Pixel 6 Pro and the Samsung S21 Ultra in the 6GHz frequency band. In both the TRP and TIS comparison, the performance of the Pixel 6 Pro is better than the S21.
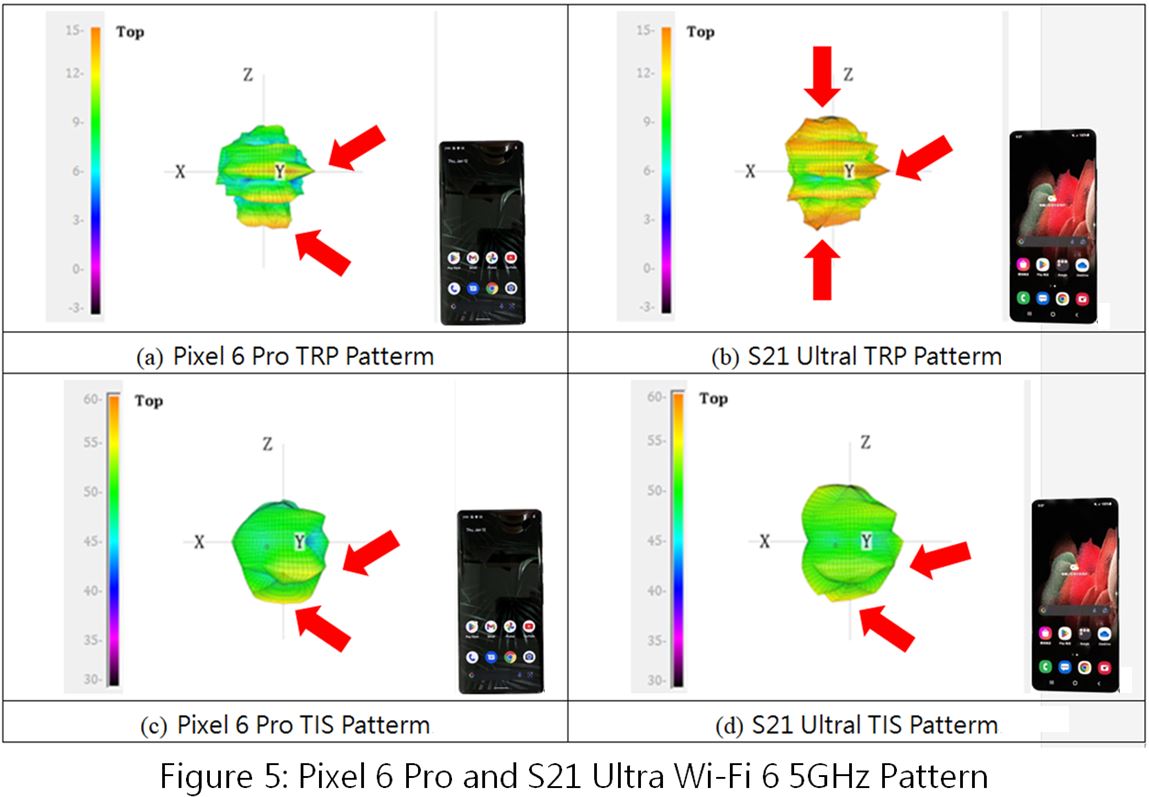
Now, we’ll proceed to observe the TRP and TIS patterns within the 5GHz frequency band for both mobile phones. From (a) in Figure 5, it can be seen that the overall pattern of the Pixel 6 Pro is close to the earpiece and the front of the screen. From (b), the strongest TRP pattern of the S21 Ultra is positioned at the upper and lower ends of the device and the front of the screen. The overall color of the pattern is orange because it is stronger. From (c) and (d), the positions with the strongest patterns of both phones are at the bottom of the phones and the front of the screens.
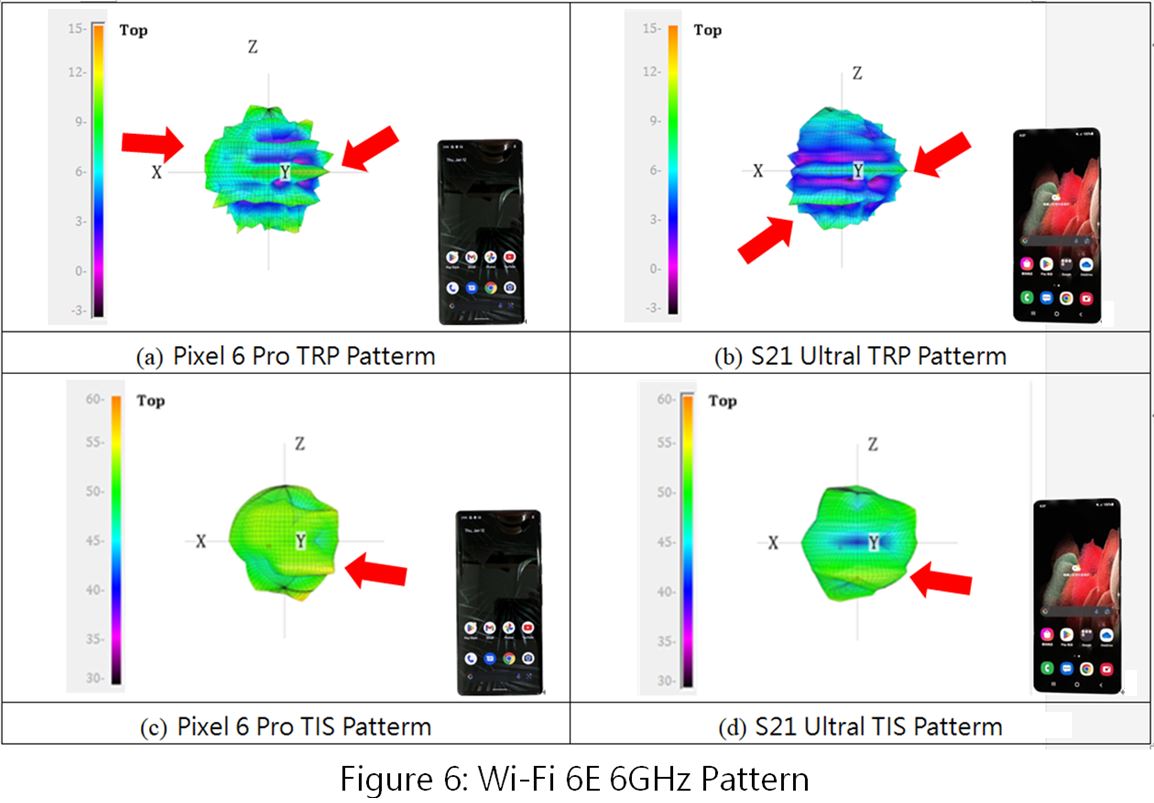
Next, let’s observe the TRP and TIS patterns of the 6Ghz frequency band. Figure 6 (a) shows that the strongest TRP pattern of the Pixel 6 Pro is near the left side of the phone and the front of the screen. Figure 6 (b) shows the strongest TRP patterns of the S21 being on the left and right sides of the device. Because of the weak TRP patterns in the S21 Ultra, the overall colors of the pattern is blue and purple. In (c) and (d), it can be seen that the Pixel 6 Pro and S21’s sensitivity is stronger at the bottom left side of the phone.
The reason for the differences in the OTA performance of the two phones may be because of the antenna. After all, it’s a real challenge to fit three frequency bands including 2.4GHz, 5GHz, and 6GHz into the mobile phone’s antenna. If the design of the antenna is bad, the overall OTA performance will be poor, leading to a bad user experience. Therefore, manufacturers must conduct Wi-Fi performance verification tests at each development stage to ensure the product will not be problematic.
EIRP and Mask Comparisons of the Samsung S21 Ultra:
So far, we haven’t seen anyone discuss the difference in transmission energy of each bandwidth. However, Allion can already provide verification services for the conditions of different RU tones. Through the base station simulator, we can observe the settings of:
- The performance of TX power wireless performance on different RU tones
- Spectral phenomena at different RU positions
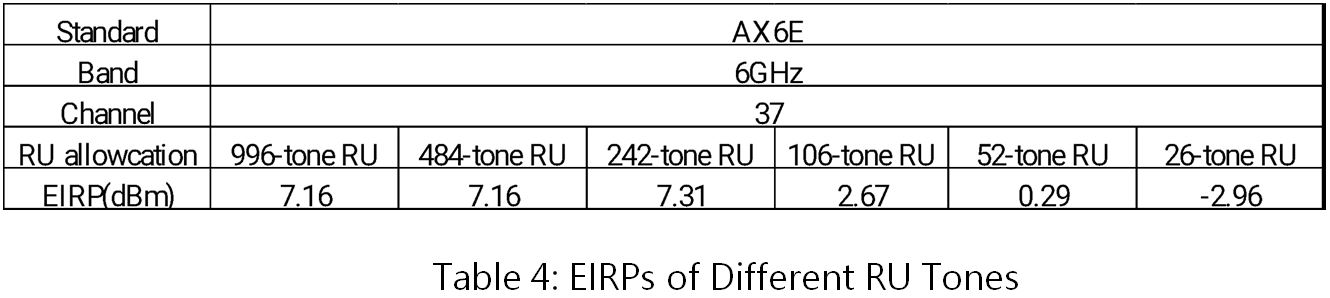
We took the S21 Ultra as an actual measurement object, set the conditions to only one user, used the 6GHz frequency band, and took the strongest EIRP in the overall OTA angle to observe its characteristics. From the results, we can know that when there is vertical polarization and when the theta axis and Phi axis are both at 90 degrees, the maximum EIRP of the S21 6GHz frequency is obtained.
The results of different RU tones are shown in Table 4, and it can be seen that the smaller the RU tone, the smaller the bandwidth, along with the EIRP energy. On the contrary, the larger the RU allowance, the larger the EIRP. The reason for the difference in the transmission of different RU tones might be that when a smaller RU tone is used, the bandwidth is more narrow, which leads to a difference in EIRP. To ensure good communication quality at relatively low energy, the requirements for the antenna’s performance will be higher.
Now we can start to observe Figure 7, which are graphs in the case of a single user. The remaining bandwidths of different RU allocations of the spectrum mask can be used by other users.
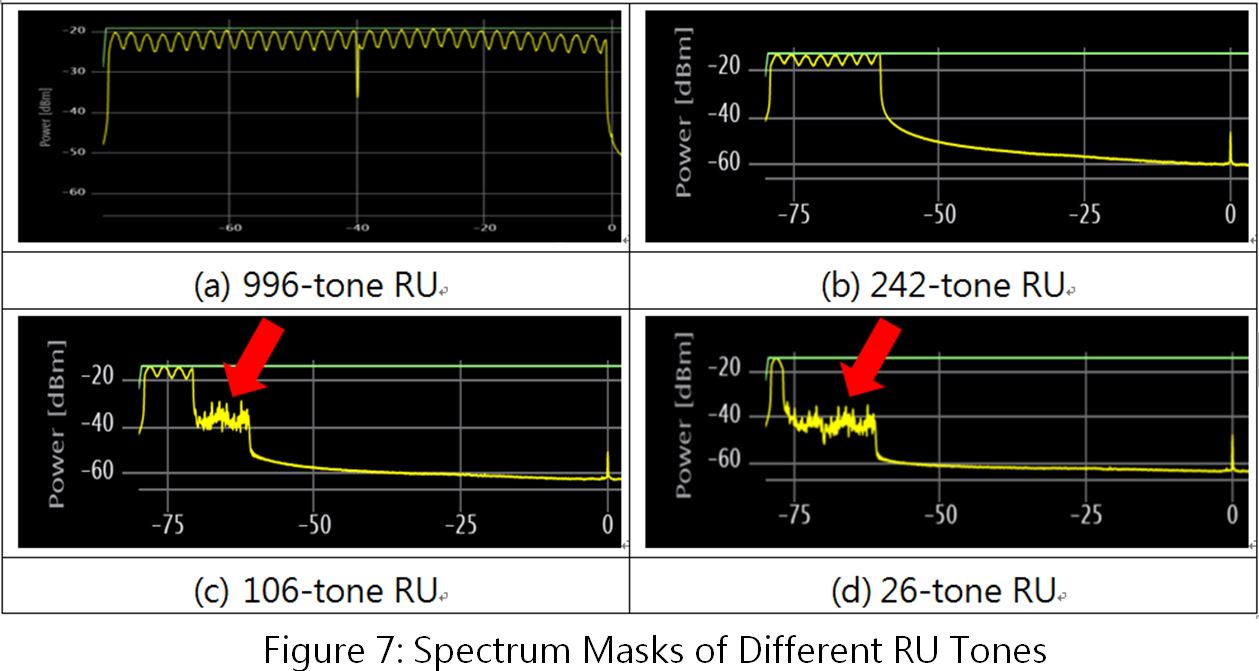
It can be seen that under different RU tone settings, the bandwidth used by the user will change accordingly. The suppression after the 106-tone RU (red arrow) is different from that of the larger RU tone. We think the main purpose of the suppression is to prevent users from interfering with one another. Different users in the same bandwidth may interfere with each other if the mask requirements aren’t met, so it’s important to pay attention to this detail.
Allion Provides Wi-Fi 6/6E OTA Testing Service
The wireless performance of the product can be found out in advance through the OTA test mentioned above and can prevent irreparable losses caused by poor performance. Only by understanding the wireless performance can the problems be reduced. Allion can help you verify the Wi-Fi wireless performance of your products and improve performance in the product development stage.
If you have any product questions or OTA testing needs, you are welcome to contact us: service@allion.com, or click the here to contact Allion easily!