


Wireless Heat Map Analysis
Wireless Heat Map Analysis
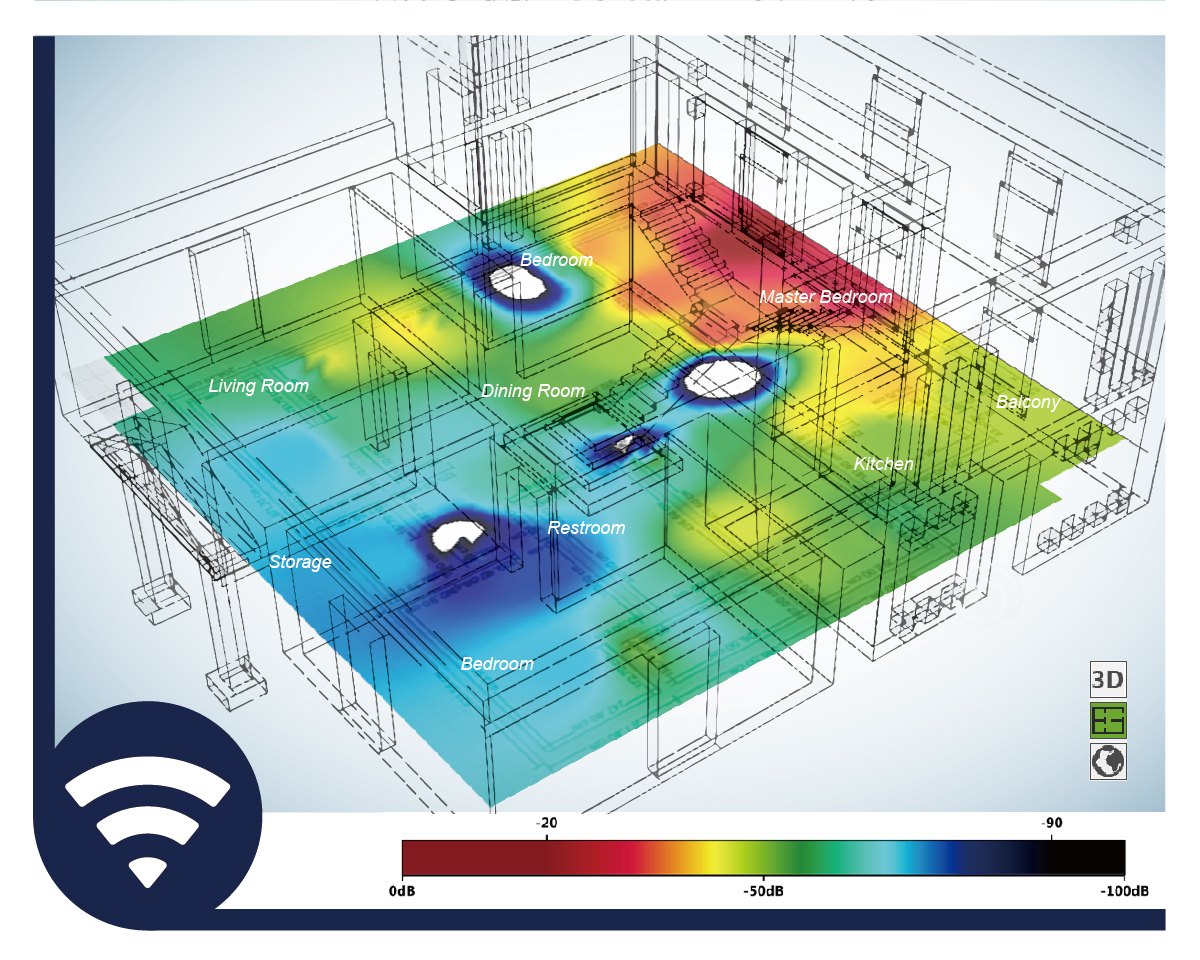
Various user scenarios (e.g. different environments and user behaviors) can affect the performance of IoT devices significantly. Unlike traditional log-linear analysis, Heat Map Analysis can visualize the signal distribution in the customized environments, allowing you to consider real-world factors during the product validation process.
Inquiry
Find Perfect Matches at Home
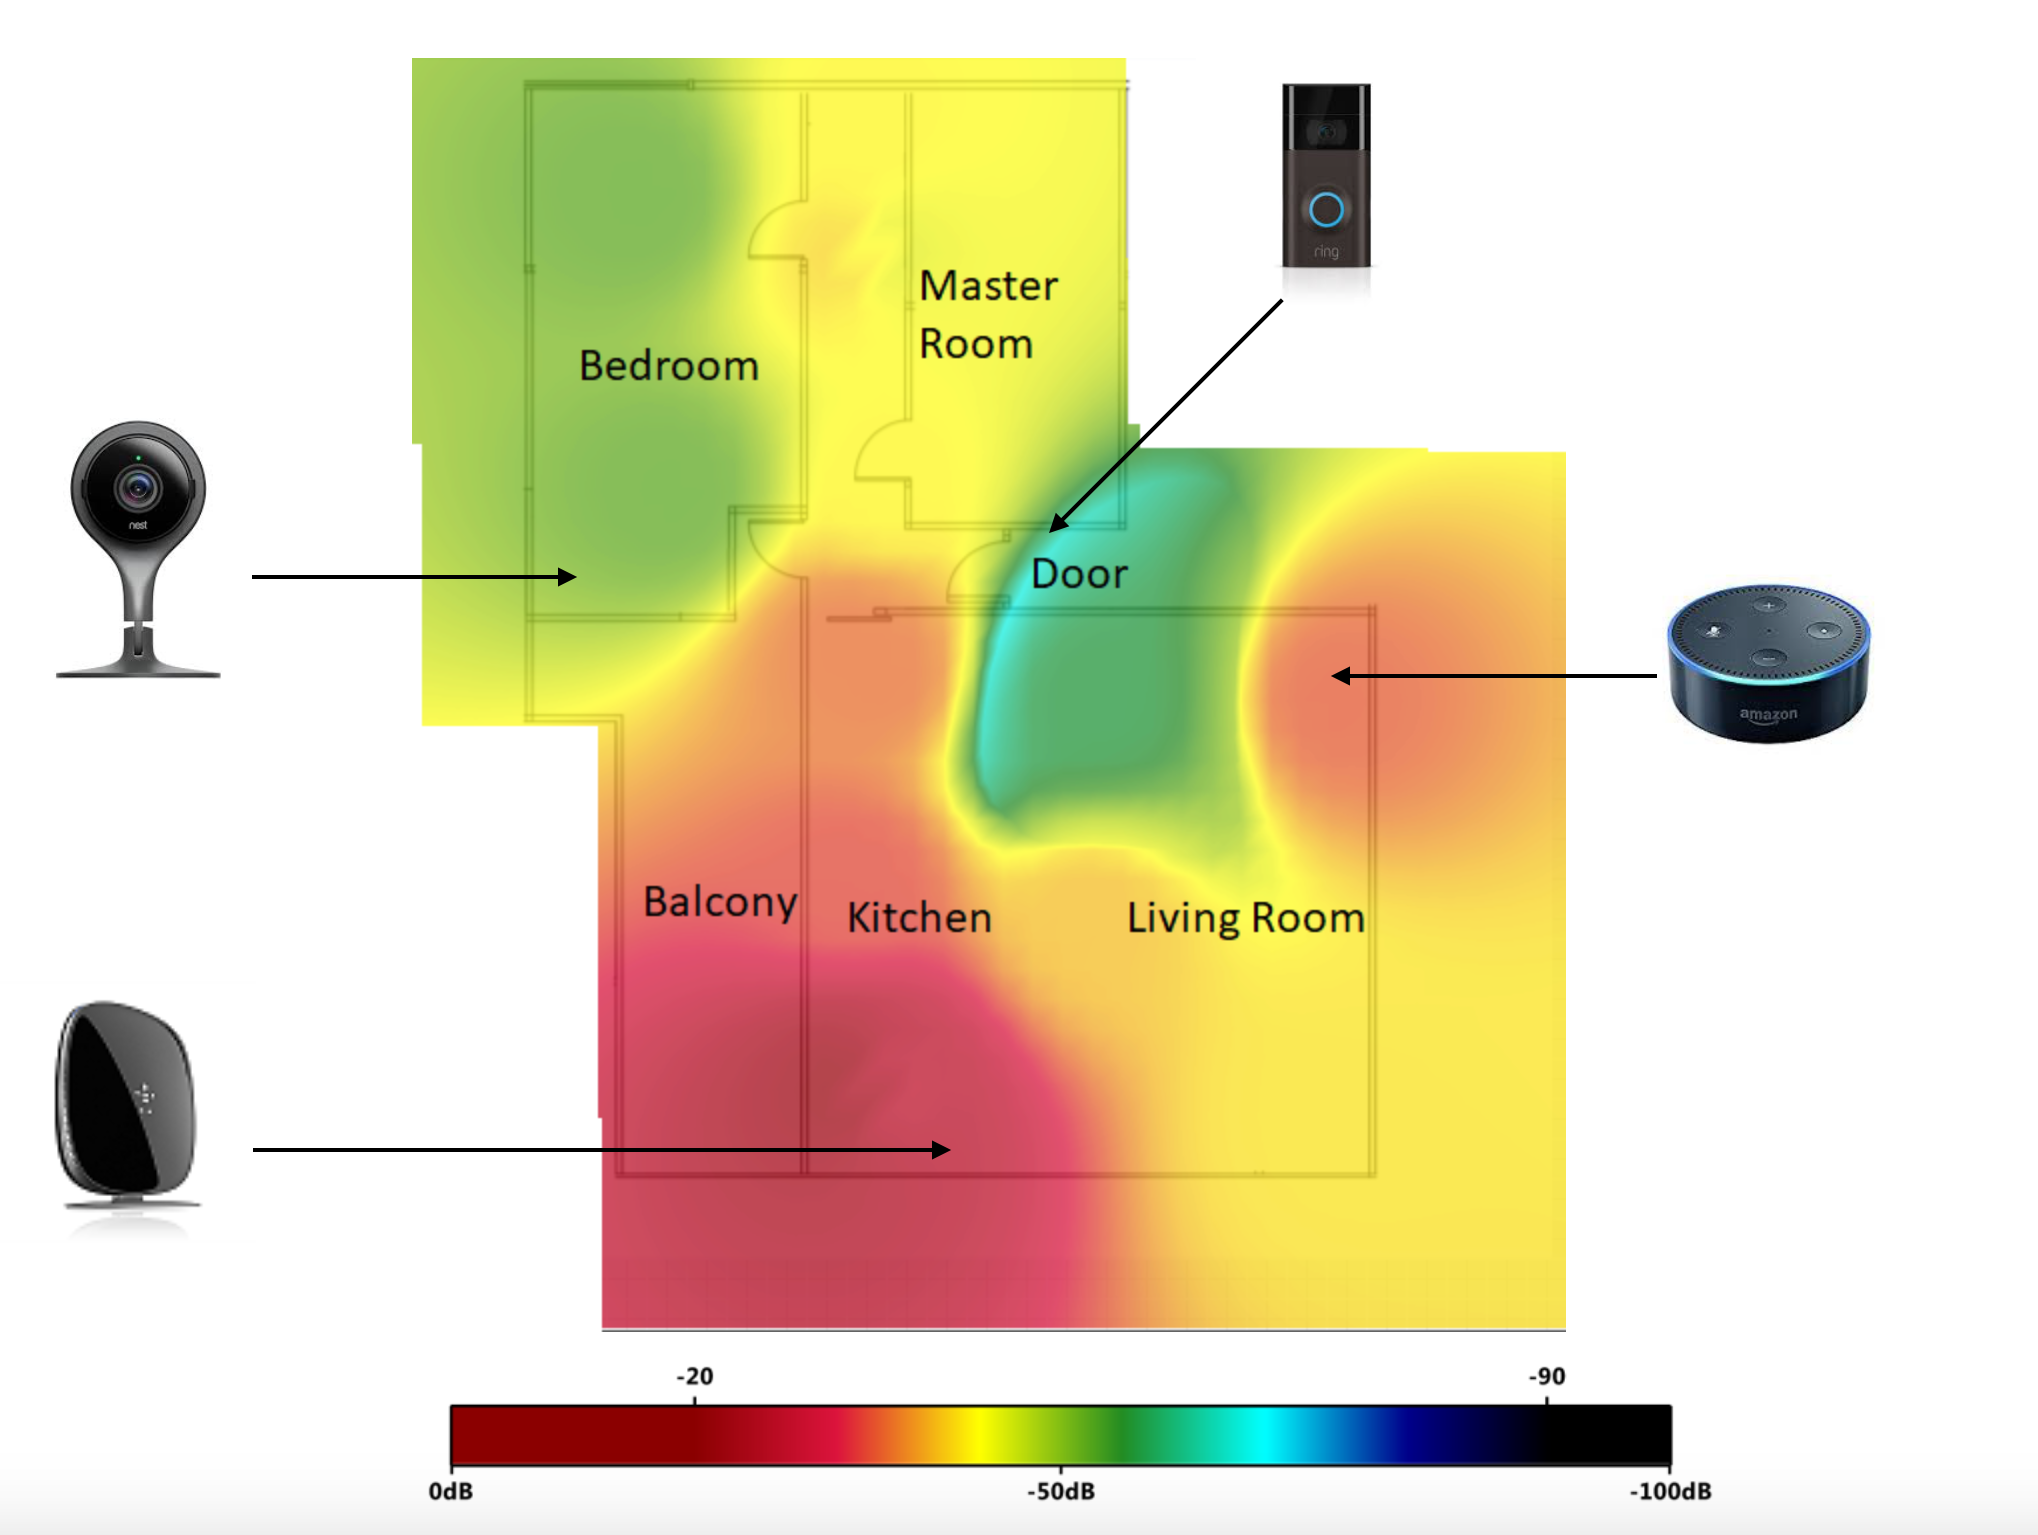
As more and more devices come on-line, the limited wireless channels have become more congested as well. The three issues below are often occurred when these signals (e.g. 4G, Wi-Fi, and Bluetooth®) coexist under the same roof, decreasing user satisfaction.
- Connectivity Instability
- Communication Latency
- Poor Roaming Capability
The Integrity of Wireless Signal
Heat Map Analysis provides an immediate visual summary for various wireless signals (e.g. Wi-Fi, Bluetooth®, Zigbee), allowing you to perceive Received Signal Strength Indicator (RSSI) to validate the connectivity and performance of smart devices.
Heat Map Analysis Reference Indicator
- Latency
- Throughput
- Packet Loss
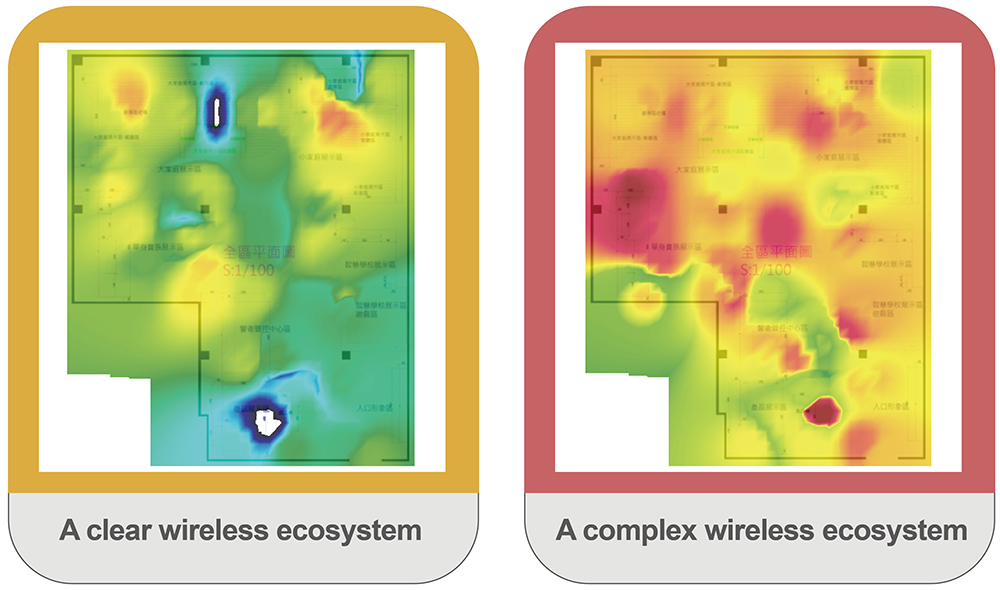
Testing in Real-World Scenarios
Since the communications of IoT devices have been extended to “one-to-many,” vendors need customized testing plans, which should include multiple situation models structured by various user scenarios (e.g. different environments and user behaviors), to help them identify root causes more accurately.
Concept of Allion’s IoT Validation Service
Common Environmental Factors
- CO (Channel Overlap)
- CCI (Co-Channel Interference)
- LOS (Line of Sight)
- NLOS (Non-Line-of-Sight)
- Distance
- Location
- Roaming
Related Test