RF Consulting Service: From Customer Complaint to an Actionable RF Design Fix in Two Weeks

From trace routing, antenna placement and mechanical tweaks to parameter tuning, we find the lowest-cost fix — with performance gains of up to 2×.

RF Consulting Service is Allion’s root-cause analysis and debug consulting service (Issue Analysis & Debug Support, IAD) for wireless product performance problems. It covers antennas, modules, system noise, multi-technology coexistence and mechanical effects, from components to complete devices, across 650 MHz to 8 GHz.

80+debug projects
10,000+ verification hours
11product categories
5 wireless technologies
1–2 weeksto isolate
and debug

Test standards last verified:

Who this service is for

When a wireless problem appears, the hardest part is usually not the fix. It is knowing what to fix.

Procurement teams and brands whose products already have problems

Dropout and slow-speed complaints after shipment call for a third party to pinpoint the root cause, instead of sorting through conflicting supplier explanations.

Clients without in-house RF engineering

You cannot tell whether your ODM’s or antenna vendor’s explanation holds up, or which metrics to check at acceptance.

Teams with RF engineers but limited experience or capacity

Cross-domain noise and coexistence issues, or several projects landing at once, call for outside support to share the load.

Which symptom are you seeing?

Customers describe problems as symptoms, not specifications. We work backward from the symptom and peel back each layer until we reach the root cause.

Symptom Common root cause How we reproduce and isolate it Environment and equipment Track record
Speed drops or the connection fails as distance increases Antenna detuning, low radiation efficiency, insufficient isolation VSWR / return loss / isolation → efficiency and radiation patterns → RvR and RvO across angles Network analyzer + 843 anechoic chamber AP router antenna detuning and placement optimization: 5 GHz performance up 1.5×
Speed drops when USB, an external monitor or a charger is connected De-sense caused by system noise Noise floor scan → probe pinpointing → RvR and TIS compared with and without load Signal analyzer + noise probe + 333 shielded room Mini desktop PC noise debugging: long-range performance up 2×
Bluetooth headset audio dropouts; wireless mouse or keyboard lag and erratic input Coexistence interference from the surroundings: nearby Wi-Fi APs and other Bluetooth devices competing for 2.4 GHz Build multiple Wi-Fi and Bluetooth interference scenarios; measure SER (sound error rate), KCR (key correct rate), mouse report rate and performance loss under coexistence Shielded room + real Bluetooth devices + simulated interference sources Wireless headset coexistence verification: reproduced the dropouts users heard across multiple Wi-Fi and Bluetooth interference scenarios
Bluetooth drops during file transfers; two radios inside the product interfere with each other Internal RF trace and antenna coupling Compare each technology running alone versus simultaneously to locate the coupling path Shield box + interference source Set-top box trace and Bluetooth antenna coexistence fix: Wi-Fi performance up 1.4×
Performance drops after an enclosure, mechanical or potting change Antenna detuning caused by enclosure dielectric effects, metal shielding or potting Measure before and after potting or drilling to confirm whether the resonance falls back into the operating band Network analyzer + 843 anechoic chamber Automotive Bluetooth system: metal structure adjusted, communication range extended to 7 m

Swipe to view the full table

IAD Flow: four steps of issue analysis and debugging

Issue Analysis & Debug. Every step has a defined output, so you always know where the project stands and what needs deciding next.

01

Reproduce the symptom

Turn the complaint into measurable conditions: distance, angle, system load and concurrently connected devices.

OutputReproduction plan

02

Layered measurement

Antenna passive → module conducted → device-level OTA → system scenario. We peel back one layer at a time to find where the gap appears.

OutputMeasurement data for each layer

03

Root-cause isolation

Compare results across layers to pinpoint whether the problem comes from the antenna, noise, coexistence or mechanics, instead of handing you a pile of data to interpret yourself.

OutputRoot-cause analysis report

04

Fix verification

Propose specific changes and measure the before-and-after difference to confirm the improvement is large enough to resolve the original complaint.

OutputImprovement recommendations with before-and-after data

Verification capabilities

Technology and frequency limits are stated separately for each test type, not summed up in a single sentence.

Wi-Fi performance
Wi-Fi 7
4×4|320 MHz
Throughput / RvR / RvO
Antenna passive measurement
650 MHz–8 GHz
VSWR, efficiency, radiation patterns, isolation
Device-level OTA measurement
2.4 / 5 / 6 GHz
TRP / TIS
Noise and coexistence analysis
0.5–8 GHz
Noise scanning plus real Wi-Fi / Bluetooth interference scenarios
Test type Coverage Main equipment
Throughput / RvR / RvO Wi-Fi 7, 4×4, 320 MHz. AP products are verified on a test platform; station products are tested against the latest commercially available AP 333 shielded room, octoBox PAL-7, AWE
Module conducted
TX power, frequency offset, modulation characteristics, RX sensitivity
Wi-Fi 6E 160 MHz, Bluetooth 5.0, LTE Rel.8 1×1 1CC R&S CMW500, Anritsu MT8862A, R&S CMW100
OTA
TRP / TIS
2.4 / 5 / 6 GHz. Wi-Fi 6E 160 MHz 1×1 SU, Bluetooth 5.0, LTE 1×1 1CC 843 anechoic chamber
Antenna passive
VSWR, efficiency, radiation patterns, isolation
650 MHz–8 GHz, independent of wireless technology Anritsu MS46322A + 843 anechoic chamber
Noise measurement 0.5–8 GHz, noise floor −120 dBm in the Wi-Fi band Keysight N9020A + noise probe
Coexistence interference
Headset dropouts, wireless peripheral lag
Create external multi-technology coexistence scenarios and measure SER (sound error rate), KCR (key correct rate), mouse report rate, and throughput and receive-sensitivity loss under coexistence. Reproduced with real devices communicating with each other, so not limited by Bluetooth version Shielded room + real Bluetooth devices + simulated interference sources

Swipe to view the full table

Bluetooth versions: Standard conducted measurement covers up to Bluetooth 5.0. Symptoms such as audio dropouts and coexistence interference are reproduced with real devices, so they are not limited by version.
5G NR: FR1 specification consulting and planning only; measurement is not included.
SER and KCR: Evaluation metrics defined by Allion, designed around how typical users hear audio and operate devices. When a client needs professional acoustic metrics, Allion’s acoustics team can join the discussion.

Verification environments

Environment Dimensions Frequency range Measurement distance Turntable load capacity
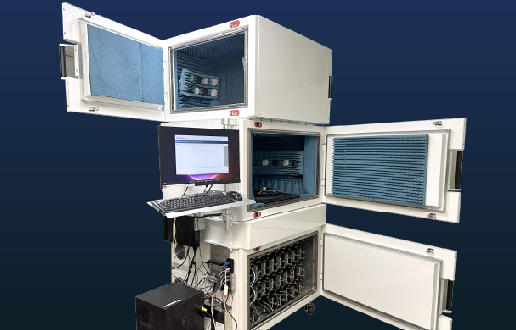
843 anechoic chamber 8 × 4 × 3.75 m 650 MHz–8 GHz 4.1 m 2D turntable 200 kg
3D positioner 5 kg
333 shielded room 3 × 3 × 3 m 650 MHz–7.1 GHz 1.6 m 25 kg
Shield box 1.1 × 0.95 × 1.2 m 650 MHz–7.1 GHz — 25 kg

Swipe to view the full table

In-house tools and team

Our test software, automation workflows and report viewer are all developed in-house, so parameters can be customized to each verification need.

RvR automation

Automatically sweeps angle, attenuation and uplink/downlink direction, at roughly twice the speed of manual testing.

In-house test software

The measurement software for antenna passive, Wi-Fi OTA and Bluetooth OTA testing is all developed in-house, so test conditions can be adjusted to match the symptom.

Consulting team

3–4 dedicated consultants with an average of 5+ years of RF experience, with backgrounds in antenna design, wireless development for branded desktop PCs, communications hardware development, and test and verification. Locating a noise source depends on this experience, not on the instruments.

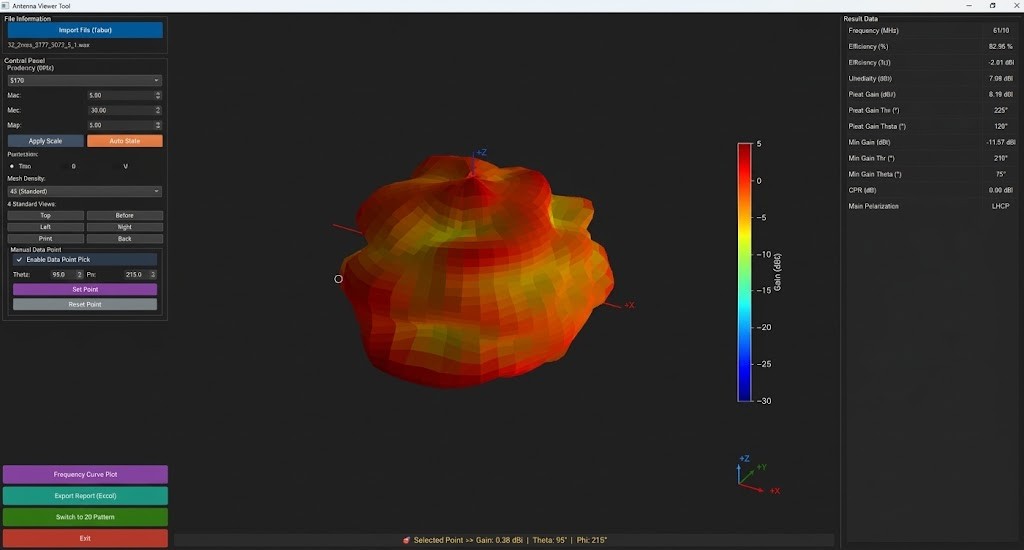
Allion Report Viewer: read radiation patterns for yourself

Measurement results ship with an offline viewer alongside the report. Click any angle on your own computer to read the actual value in that direction, then map weak directions to the product’s real placement and enclosure openings.

Antenna passive measurement tool showing a 3D radiation pattern with efficiency, directivity, peak gain and angle values.
Antenna passive measurement: Click any angle to read the gain in that direction. Switch between Total / H / V polarization, compare frequency by frequency, or switch to 2D patterns and frequency curves.
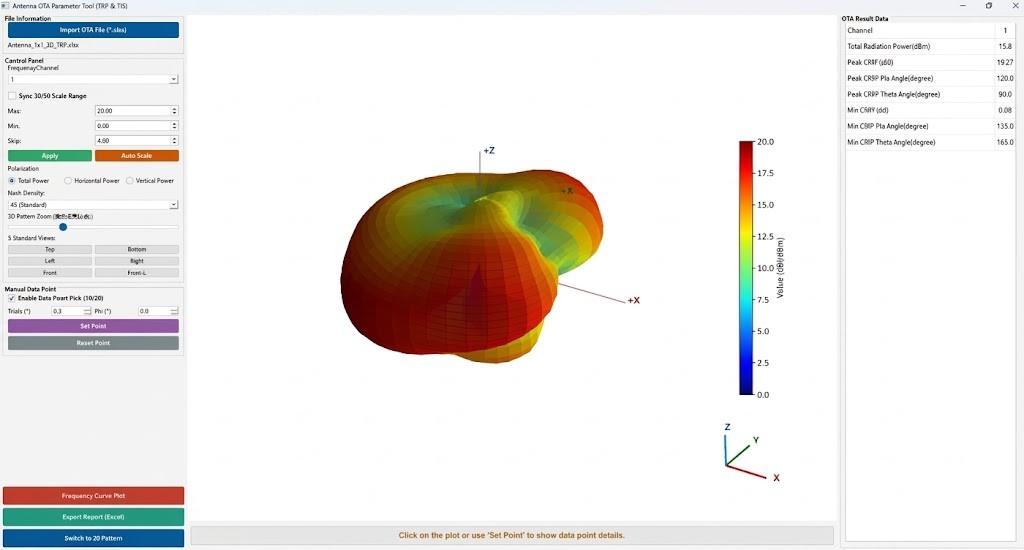
Device-level OTA measurement tool showing the 3D EIRP distribution, total radiated power, and the angles of peak and minimum EIRP.
Device-level OTA measurement: View EIRP and EIS distribution channel by channel. 3D and 2D views share a synchronized scale, so version comparisons are not skewed by the color map.
The antenna shown above varies by 17.8 dB between its strongest and weakest directions. At the device level, the same product’s EIRP spread reaches 19.2 dB. Choose the wrong placement angle or mechanical shielding and this is where the performance goes. You can only fix it once you can see it.

Before and after working with Allion

For the same verification items, the difference between automated and manual interpretation comes down to time and readability.

Evaluation item Conventional approach With Allion Benefit
RvR sweeps across angle and attenuation Each point set manually, each result recorded by hand Automatic sweeps of angle, attenuation and uplink/downlink Verification time roughly halved
Reading 3D radiation patterns A few fixed-view screenshots in the report Offline Viewer: read EIRP / EIS at any angle, switch polarization and 2D / 3D Clients map results to placement and openings themselves
Adjusting test parameters Limited to the conditions built into off-the-shelf software In-house software customizes parameters to the symptom Reproduction conditions closer to the actual complaint
Locating noise sources Trial-and-error part swaps and multiple prototype rounds Probe measurement interpreted by engineers with industry backgrounds Points directly to the noise source and the fix direction

Swipe to view the full table

Supplier management support

For procurement teams, the difficulty is not knowing that the product has a problem. It is judging whether a supplier’s explanation holds up.

Third-party data you can negotiate with

Independent measurement results give procurement teams a basis for making specific requests of antenna vendors and ODMs.

Acceptance testing of revisions on your behalf

Allion measures the performance difference after an antenna revision or mechanical change, and closes the case only once the fix is confirmed.

Direct contact with suppliers when needed

With your authorization, we can discuss technical details directly with the antenna vendor. Track record: a single project evaluating 2 antenna vendors and 4 design versions side by side.

Test standards

The standards and sources each test type actually follows, with versions and the last-verified date.

Last verified:

Test type Basis Source
Wi-Fi conducted IEEE 802.11 or the module datasheet IEEE 802.11 Working Group
Wi-Fi throughput Criteria recommended by Allion based on product positioning and use case; BBF TR-398 when the client has no existing standard Broadband Forum Technical Library
Bluetooth conducted Bluetooth SIG RF-PHY test specification and the module datasheet Bluetooth SIG Specifications
LTE conducted 3GPP TS 36.521, Rel.8 3GPP Specifications
OTA (TRP / TIS) CTIA OTA test plan; the 843 anechoic chamber is built to this plan CTIA Certification Test Plans
Antenna passive Industry practice, with criteria recommended by Allion based on product positioning and use case —
Coexistence interference (SER / KCR) Allion-defined metrics designed around typical users’ listening and operating experience. Our acoustics team supports projects that need professional acoustic metrics —
Competitive benchmark Competitor products specified by the client or commercially available, measured simultaneously in the same environment under the same conditions. Used as the criterion when no absolute standard exists —

Swipe to view the full table

When a product has no standard threshold to compare against, measured competitor values are the most practical criterion. Allion measures them in the same environment with the same settings at the same time to keep the comparison fair. Component- and device-level competitive benchmarking is within the scope of this service; for system-level and telecom operator benchmarking, see Wireless Performance Consulting.

Service phases and deliverables

Our consulting covers every milestone of product development, and can also step in on its own after a problem occurs.

Phase Consulting service Deliverables
RFP / RFQ Draft or review tender documents; review ODM proposals and test reports Document review comments, ODM report review
EVT Verification planning, component selection advice, antenna placement proposals Verification plan, executive summary, final report
DVT Issue analysis and debug support (IAD Flow) Verification plan, executive summary, root-cause analysis report
PVT Competitive analysis verification plan, independent third-party performance report Competitive analysis plan, executive summary, competitive analysis report
Complaint analysis Issue reproduction and analysis plan, improvement proposal Complaint analysis and verification plan, executive summary, analysis report with specific improvement proposal

Swipe to view the full table

Standalone engagement: antenna active and passive measurement

If you do not need a full debug engagement and only want to confirm the antenna is right, you can commission antenna active and passive measurement on its own. Passive measurement covers VSWR, return loss, isolation, radiation efficiency and 2D / 3D radiation patterns; active measurement covers device-level OTA TRP and TIS. Deliverables include the offline Report Viewer.

Track record

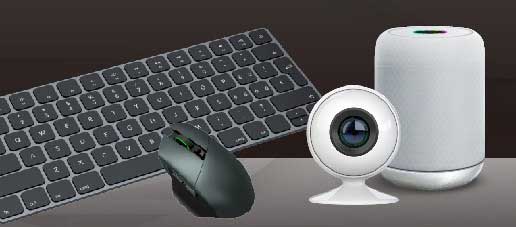
Covering 11 product categories, from notebooks, set-top boxes and AP routers to automotive electronics and IP cameras.

Representative results

2×Long-range performance gainMini desktop PC
Antenna and noise improvement
1.5×5 GHz performance gainWi-Fi AP router
Antenna detuning and placement optimization
7 mBluetooth communication rangeAutomotive Bluetooth OBD system
Metal structure adjustment
Client type and region Issue Outcome
Japanese notebook PC brandMini desktop PC Internal verification found poor Wi-Fi performance Long-range performance doubled after antenna and noise improvements
Global gaming peripheral brandWireless headset Users reported audio dropouts during gameplay, but spec tests showed no problem Measured SER with a head and torso simulator and artificial ears across four interference scenarios and three wearing angles, reproducing the dropouts users heard. Found that the dual-mode headset was more susceptible to interference over Bluetooth than over its dongle
Indian ISPSet-top box Poor Wi-Fi performance and frequent Bluetooth disconnections Resolved RF trace and Bluetooth antenna coexistence interference; Wi-Fi performance up 1.4×
Chinese telecom contract manufacturerWi-Fi AP router Trailed competitors in an operator benchmark Antenna detuning and placement optimization raised 5 GHz performance 1.5×, with no antenna replacement or major PCB redesign
Taiwanese automotive electronics supplierBluetooth OBD system Post-launch complaints of short range and frequent disconnections Potting had detuned the antenna; after the metal structure was adjusted, range reached 7 m
U.S. tablet accessory makeriPad POS solution High volume of complaints about weak LTE signal and dropped connections Traced to a specific enclosure structure; LTE performance improved significantly after adjustment
U.S. electronics manufacturing services companyTablet system Performance degraded once mounted in a metal enclosure Identified the shielding source and proposed a fix suitable for mass production
North American communications service providerTV dongle and controller Unclear which metrics affect user experience Defined RF performance acceptance criteria and evaluated how antenna count affects key metrics
Internet technology company, other marketsSmart speaker First product had no performance evaluation baseline Built a quantitative wireless performance evaluation framework and a competitive analysis report
Japanese telecom operatorCPE Next-generation product specifications not yet defined Defined quantifiable wireless specifications and helped review ODM test reports

Swipe to view the full table

Before you start

How complete your samples and information are directly determines how many days reproduction takes.

01

Prepare 2–3 samples

One for testing and one as a spare; one of them must be modifiable.

02

Confirm one unit can be modified

Antenna passive and module conducted measurements require soldering an RF cable and drilling the enclosure. Without modification, we can measure only device-level results and cannot tell whether the problem lies in the antenna itself or in the system.

03

Write up a reproducible symptom description

Provide the model, the distance at which the problem occurs, the environment and the devices connected at the time. The more specific the description, the faster the reproduction.

Lead time (counted from sample arrival)Single-symptom isolation: within 1 weekFull-device debugging: within 2 weeksWhen no other project is queued: testing starts within 2 business days of sample arrival

FAQ

These are the nine questions our sales and engineering inboxes receive most often.

Our product passed every lab test. Why do customers still lose connection?

Standard tests verify spec compliance in a clean environment. Complaints happen in real environments, where multiple wireless technologies run at once, mechanics block the signal and system noise is present. IAD Flow starts by reproducing the symptom, compares lab and field conditions, isolates the root cause and verifies the fix. The same analysis can also guide early development verification for your next-generation product.

Do you have to solder an RF cable to the sample and drill the enclosure?

Antenna passive and module conducted measurements require modification. Without it, we can measure only device-level results and cannot tell whether the problem lies in the antenna itself or in the system. We recommend preparing 2–3 samples, one of which can be modified.

How long from sending samples to receiving the report?

Single-symptom isolation takes up to 1 week, and full-device debugging up to 2 weeks, counted from sample arrival. When no other project is queued, testing starts within 2 business days of sample arrival.

Can you test Wi-Fi 7?

Yes. Throughput and RvR testing supports up to 4×4 320 MHz. Conducted and OTA measurements currently cover up to Wi-Fi 6E 160 MHz.

My device uses Bluetooth 5.3. Can you handle it?

Yes. Audio dropouts and coexistence interference are reproduced with real devices, so they are not limited by Bluetooth version. Only standard conducted measurement is limited by equipment, and it currently covers up to Bluetooth 5.0.

Once the problem is found, how does Allion help fix it? Will you work with my suppliers?

We provide root-cause analysis and specific improvement recommendations. You or your procurement team make the request to the supplier, and Allion can verify the performance difference before and after the revision on your behalf. With your authorization, we can also discuss technical details directly with the supplier, such as the antenna vendor.

We don’t have RF engineers. How can we use your report?

The report comes with the offline Report Viewer, which can be read without an RF background. Click any angle to see EIRP / EIS values, switch between 2D and 3D, and map weak directions to the product’s real placement and openings. Beyond raw data, the report includes issue analysis and improvement recommendations you can use directly in discussions with suppliers.

We’re not sure it’s an RF problem. Can you still help?

Yes. We first make an initial assessment, then recommend an approach based on the type of problem:

  • Only one sample is abnormal: we check assembly, related connectors and RF cable routing to rule out unit-to-unit variation.
  • Firmware or software settings are suspected: we provide initial analysis results, and you adjust the product’s RF parameters.
  • The problem cannot be reproduced reliably: we help organize the symptom, affected models, environment and connected devices to establish reproduction conditions.

Our product is still at the layout stage with no physical samples. Can you give RF design advice?

Yes. This falls under EVT-stage design review and component selection advice. We review antenna placement, component selection and routing based on the product structure and make recommendations; once physical samples are available, we verify through measurement that the recommendations deliver.

Related services

Other wireless verification services. Choose the page that matches your issue.

Inquiry

For more information on RF Consulting Service, please contact us.

Inquiry